Why is the USD to INR Exchange Rate up today on 15th August 2022 (1st half of August 2022)?
In July, the Indian rupee touched an all-time high of 80 rupees per dollar. It shook the Indian economy very badly. The Reserve Bank of India (RBI), which protects macroeconomic stability, has come up with several monetary policies and contingency plans to help recover the value of the rupee. Some of these steps include increasing the repo rates by 50 basis points. The rupee has regained momentum; however, there is still a long way to go.
| USD to INR Exchange Rates (1 USD into INR) | ||||
|---|---|---|---|---|
| Date | Open | High | Low | Close |
| 01-Aug-22 | 79.19 | 79.43 | 78.90 | 79.19 |
| 02-Aug-22 | 78.96 | 79.17 | 77.77 | 78.96 |
| 03-Aug-22 | 78.60 | 79.20 | 78.57 | 78.60 |
| 04-Aug-22 | 79.12 | 79.80 | 79.01 | 79.12 |
| 05-Aug-22 | 79.15 | 79.49 | 78.92 | 79.15 |
| 08-Aug-22 | 79.41 | 79.76 | 79.31 | 79.41 |
| 09-Aug-22 | 79.60 | 79.81 | 79.44 | 79.60 |
| 10-Aug-22 | 79.58 | 79.75 | 79.01 | 79.58 |
| 11-Aug-22 | 79.10 | 79.79 | 79.05 | 79.10 |
| 12-Aug-22 | 79.61 | 79.94 | 79.56 | 79.61 |
| 15-Aug-22 | 79.63 | 79.73 | 79.47 | 79.63 |
From the above graph and table, one can infer that a dollar has equaled an average of 79.3 rupees, slightly less than the average in the last two weeks of July. The rupee hit a bottom of 79.93 rupees on the 12th of August 2022 and a peak of 77.77 on the 2nd of August 2022. The USD to INR exchange rate decreased initially. It has been increasing since the 3rd of August 2002.
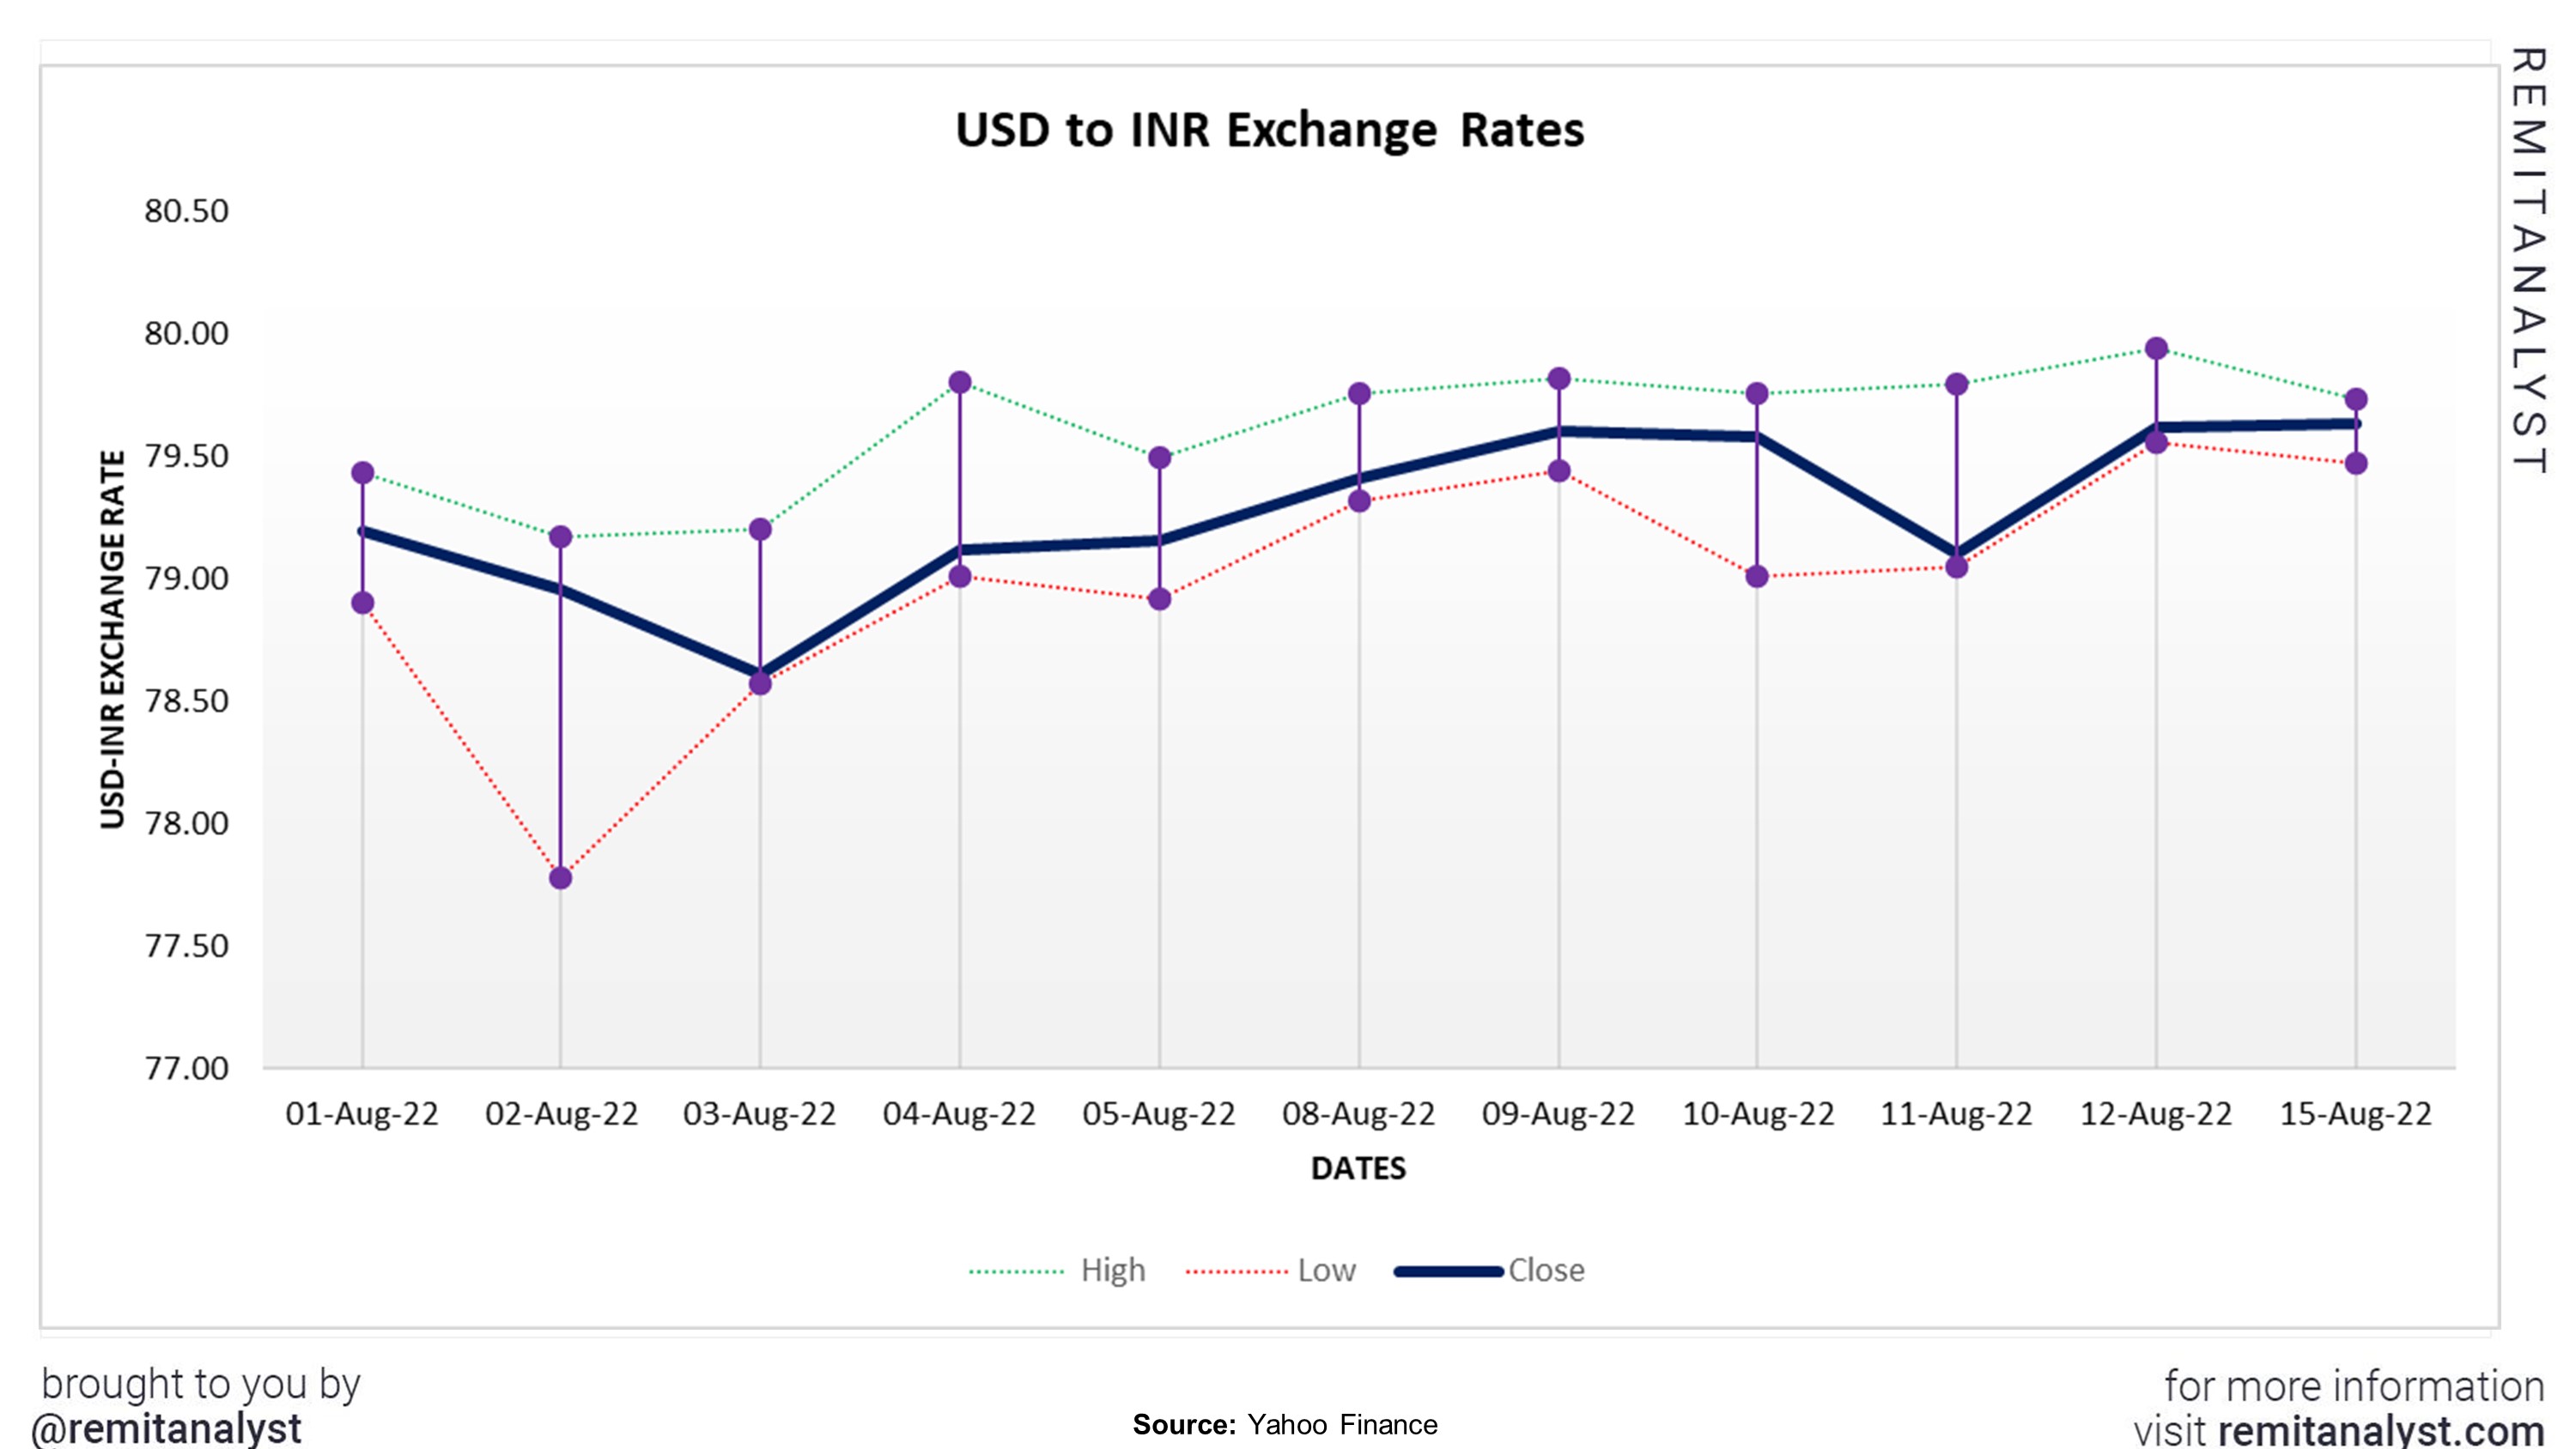
Such an unpredictable performance is a worrying sign for the Indian economy and currency. The currency’s value differed positively or negatively by an average of 0.25 rupee daily for the past two weeks (1st of August 2022 to the 15th of August 2022). Such a high variance shows the weakness of the rupee. The government and the RBI are doing everything in their power to help improve the currency’s value; however, it will take time.
Many factors must perform relatively well if the currency is solid and stable. They are:
1. Crude Oil
For crude oil and related products, most countries depend on crude oil giants, such as the UAE, Russia, and Saudi Arabia. Every country is dependent on each other for goods and trade. Unforeseen and unprecedented situations such as the Ukraine-Russia conflict, China-Taiwan conflict, Forest fires, and the Energy crisis in Europe affect world trade, as trade barriers get imposed. A country’s currency depends on the trade balance; therefore, when a country imports more than it exports, the value of the currency falls. In May 2022, oil prices touched an all-time high of $120 per barrel. India imports over 85% of crude oil from other countries. In the first quarter of the financial year 2022- 23, India imported 60.2 million tonnes of oil worth $47.5B. This was significantly higher by 89% than the amount spent in the previous quarter (fourth quarter of the financial year 2021-22). Similarly, the US also faced an increase in demand; however, it could not cater to such needs due to trade barriers.
| Crude Oil (in USD) | ||||
|---|---|---|---|---|
| Date | Open | High | Low | Close |
| 01-Aug-22 | 98.46 | 98.65 | 92.42 | 93.89 |
| 02-Aug-22 | 93.75 | 96.47 | 92.59 | 94.42 |
| 03-Aug-22 | 93.83 | 96.57 | 90.38 | 90.66 |
| 04-Aug-22 | 90.95 | 91.90 | 87.55 | 88.54 |
| 05-Aug-22 | 88.06 | 90.76 | 87.01 | 89.01 |
| 08-Aug-22 | 88.46 | 90.89 | 87.22 | 90.76 |
| 09-Aug-22 | 90.69 | 92.65 | 89.05 | 90.50 |
| 10-Aug-22 | 90.51 | 92.43 | 87.66 | 91.93 |
| 11-Aug-22 | 91.55 | 95.05 | 91.24 | 94.34 |
| 12-Aug-22 | 94.09 | 94.81 | 91.16 | 92.09 |
| 15-Aug-22 | 91.94 | 92.1 | 86.82 | 89.41 |
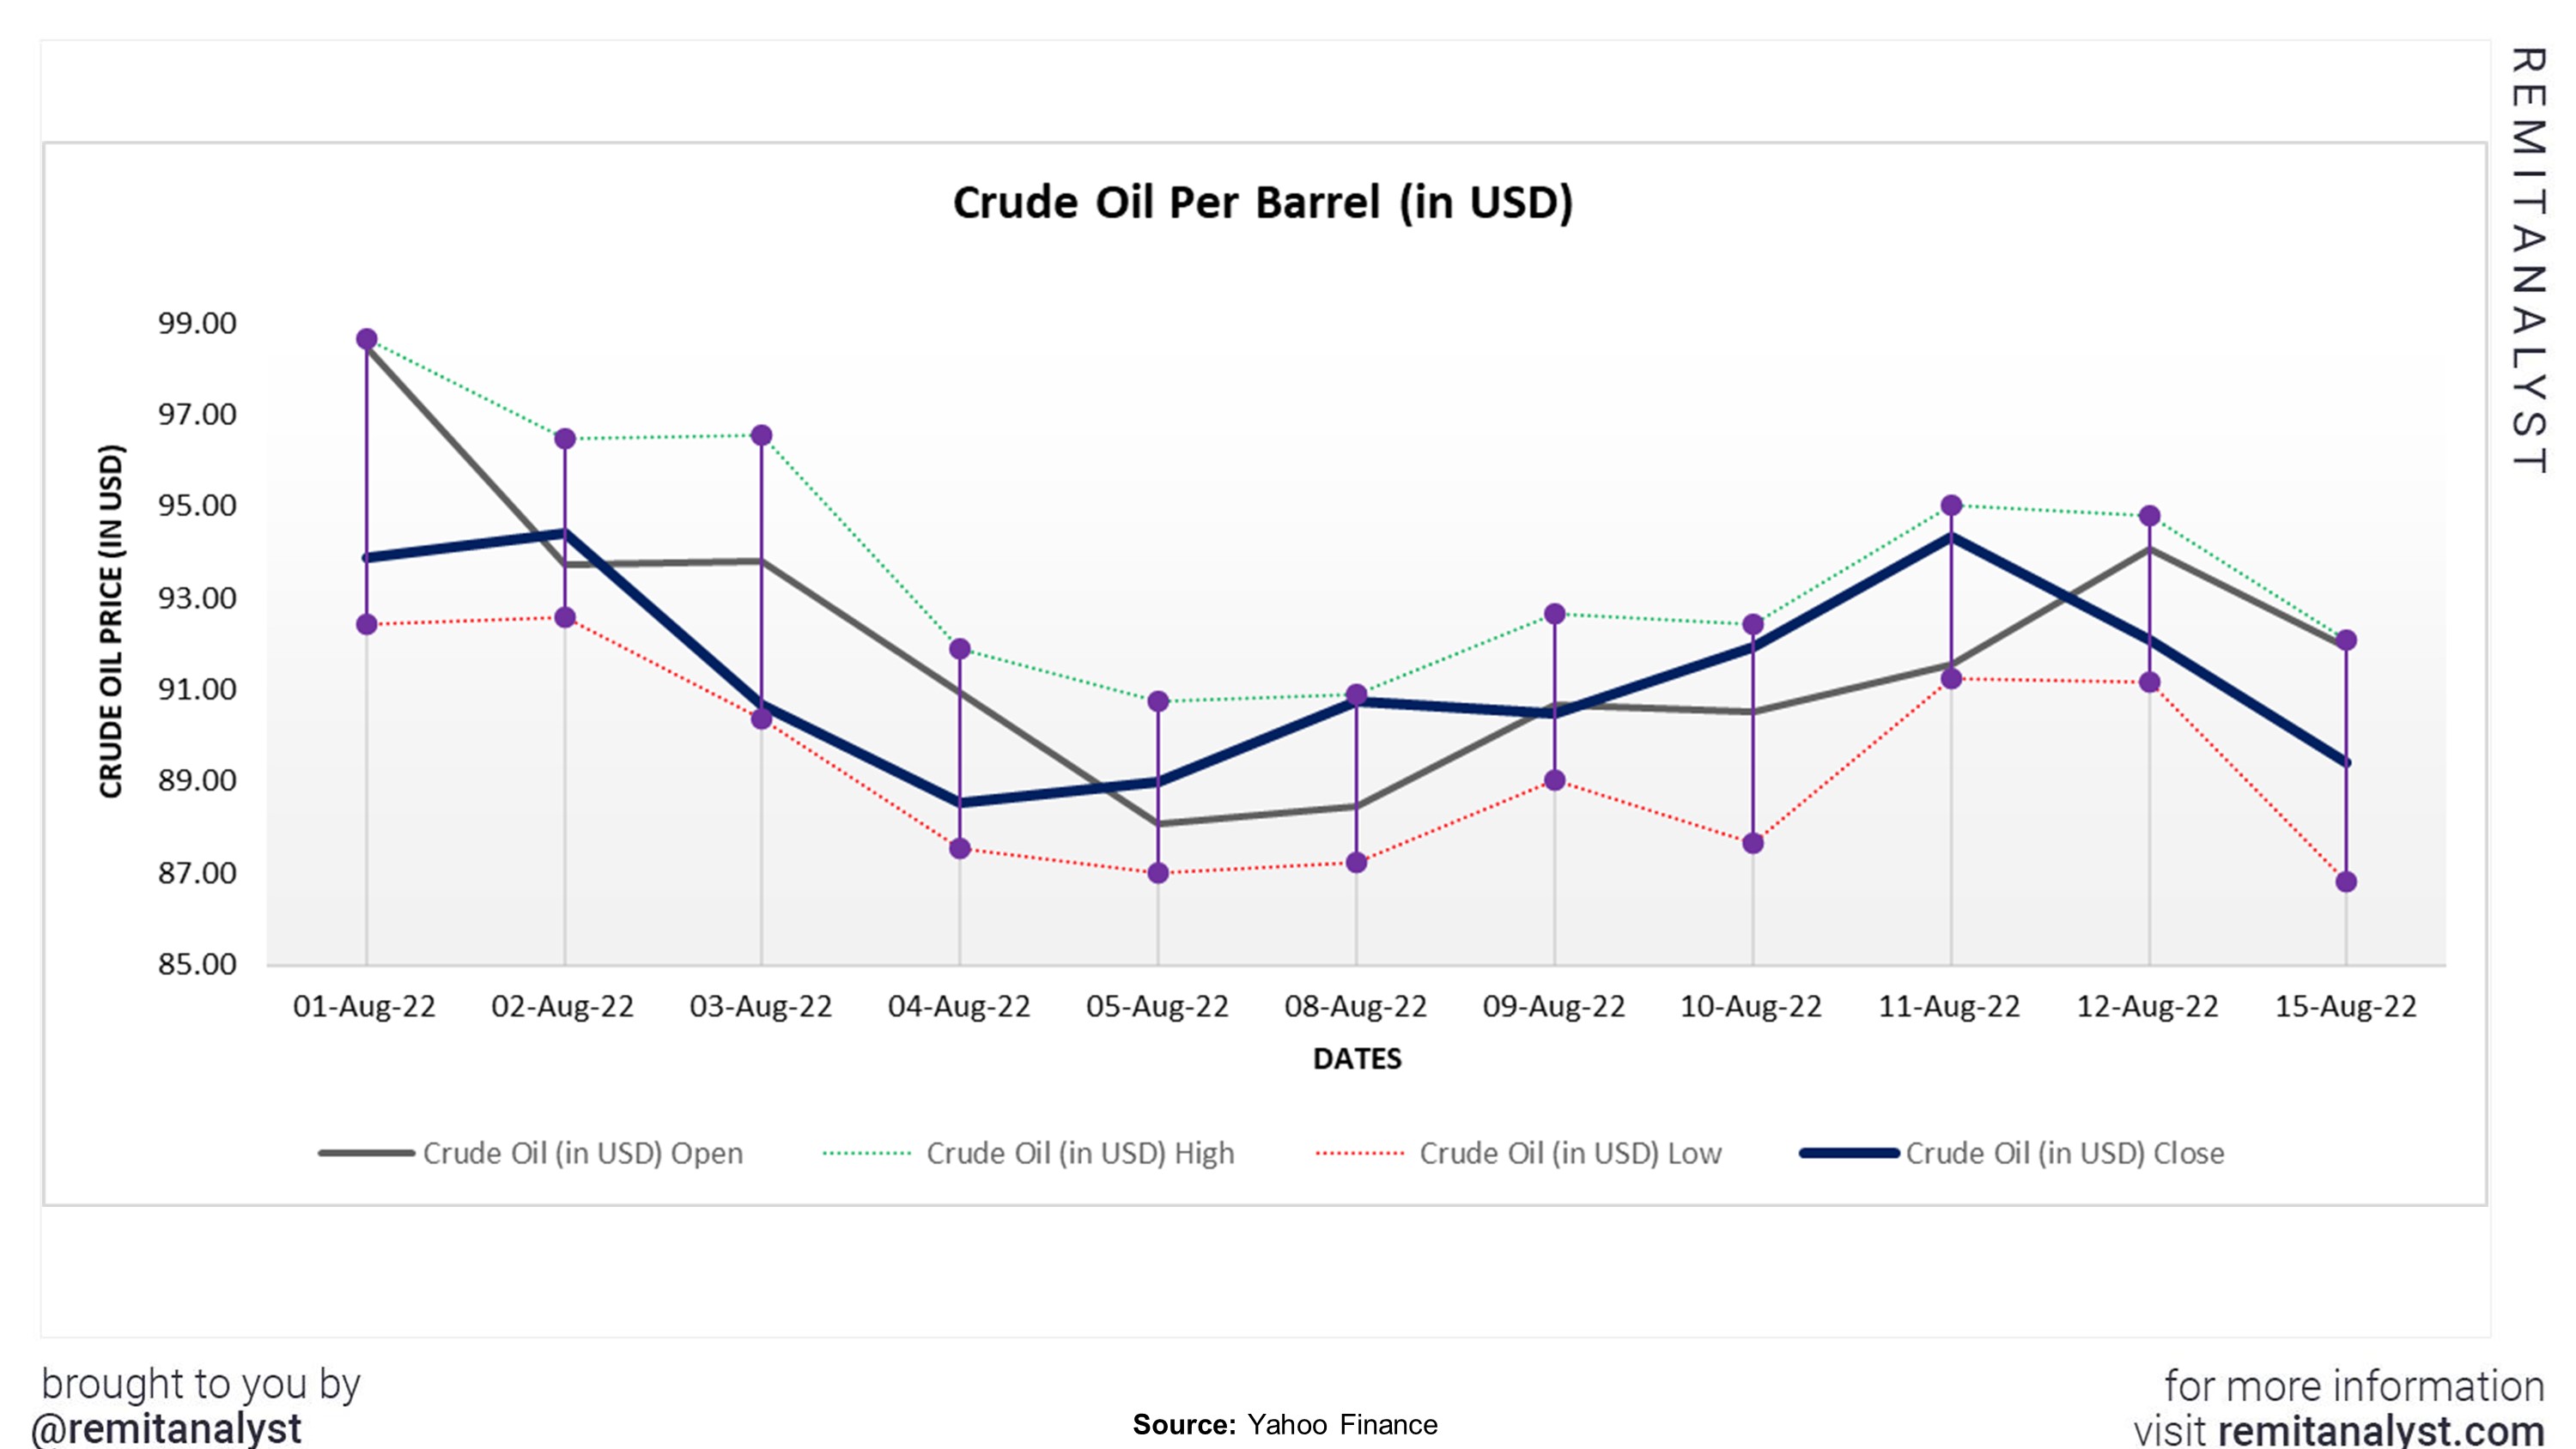
The price decreased significantly from the 1st of August 2022 to the 4th of August 2022. However, the price has been increasing ever since. On the 1st of August 2022, the prices peaked at $98.65 per barrel, whereas on the 5th of August 2022, the prices reached a low of $87.01 per barrel. Every manufacturing, transportation, and related industry dependancy on crude oil. Such costs can hinder production, raising inflation and devaluing the Indian currency.
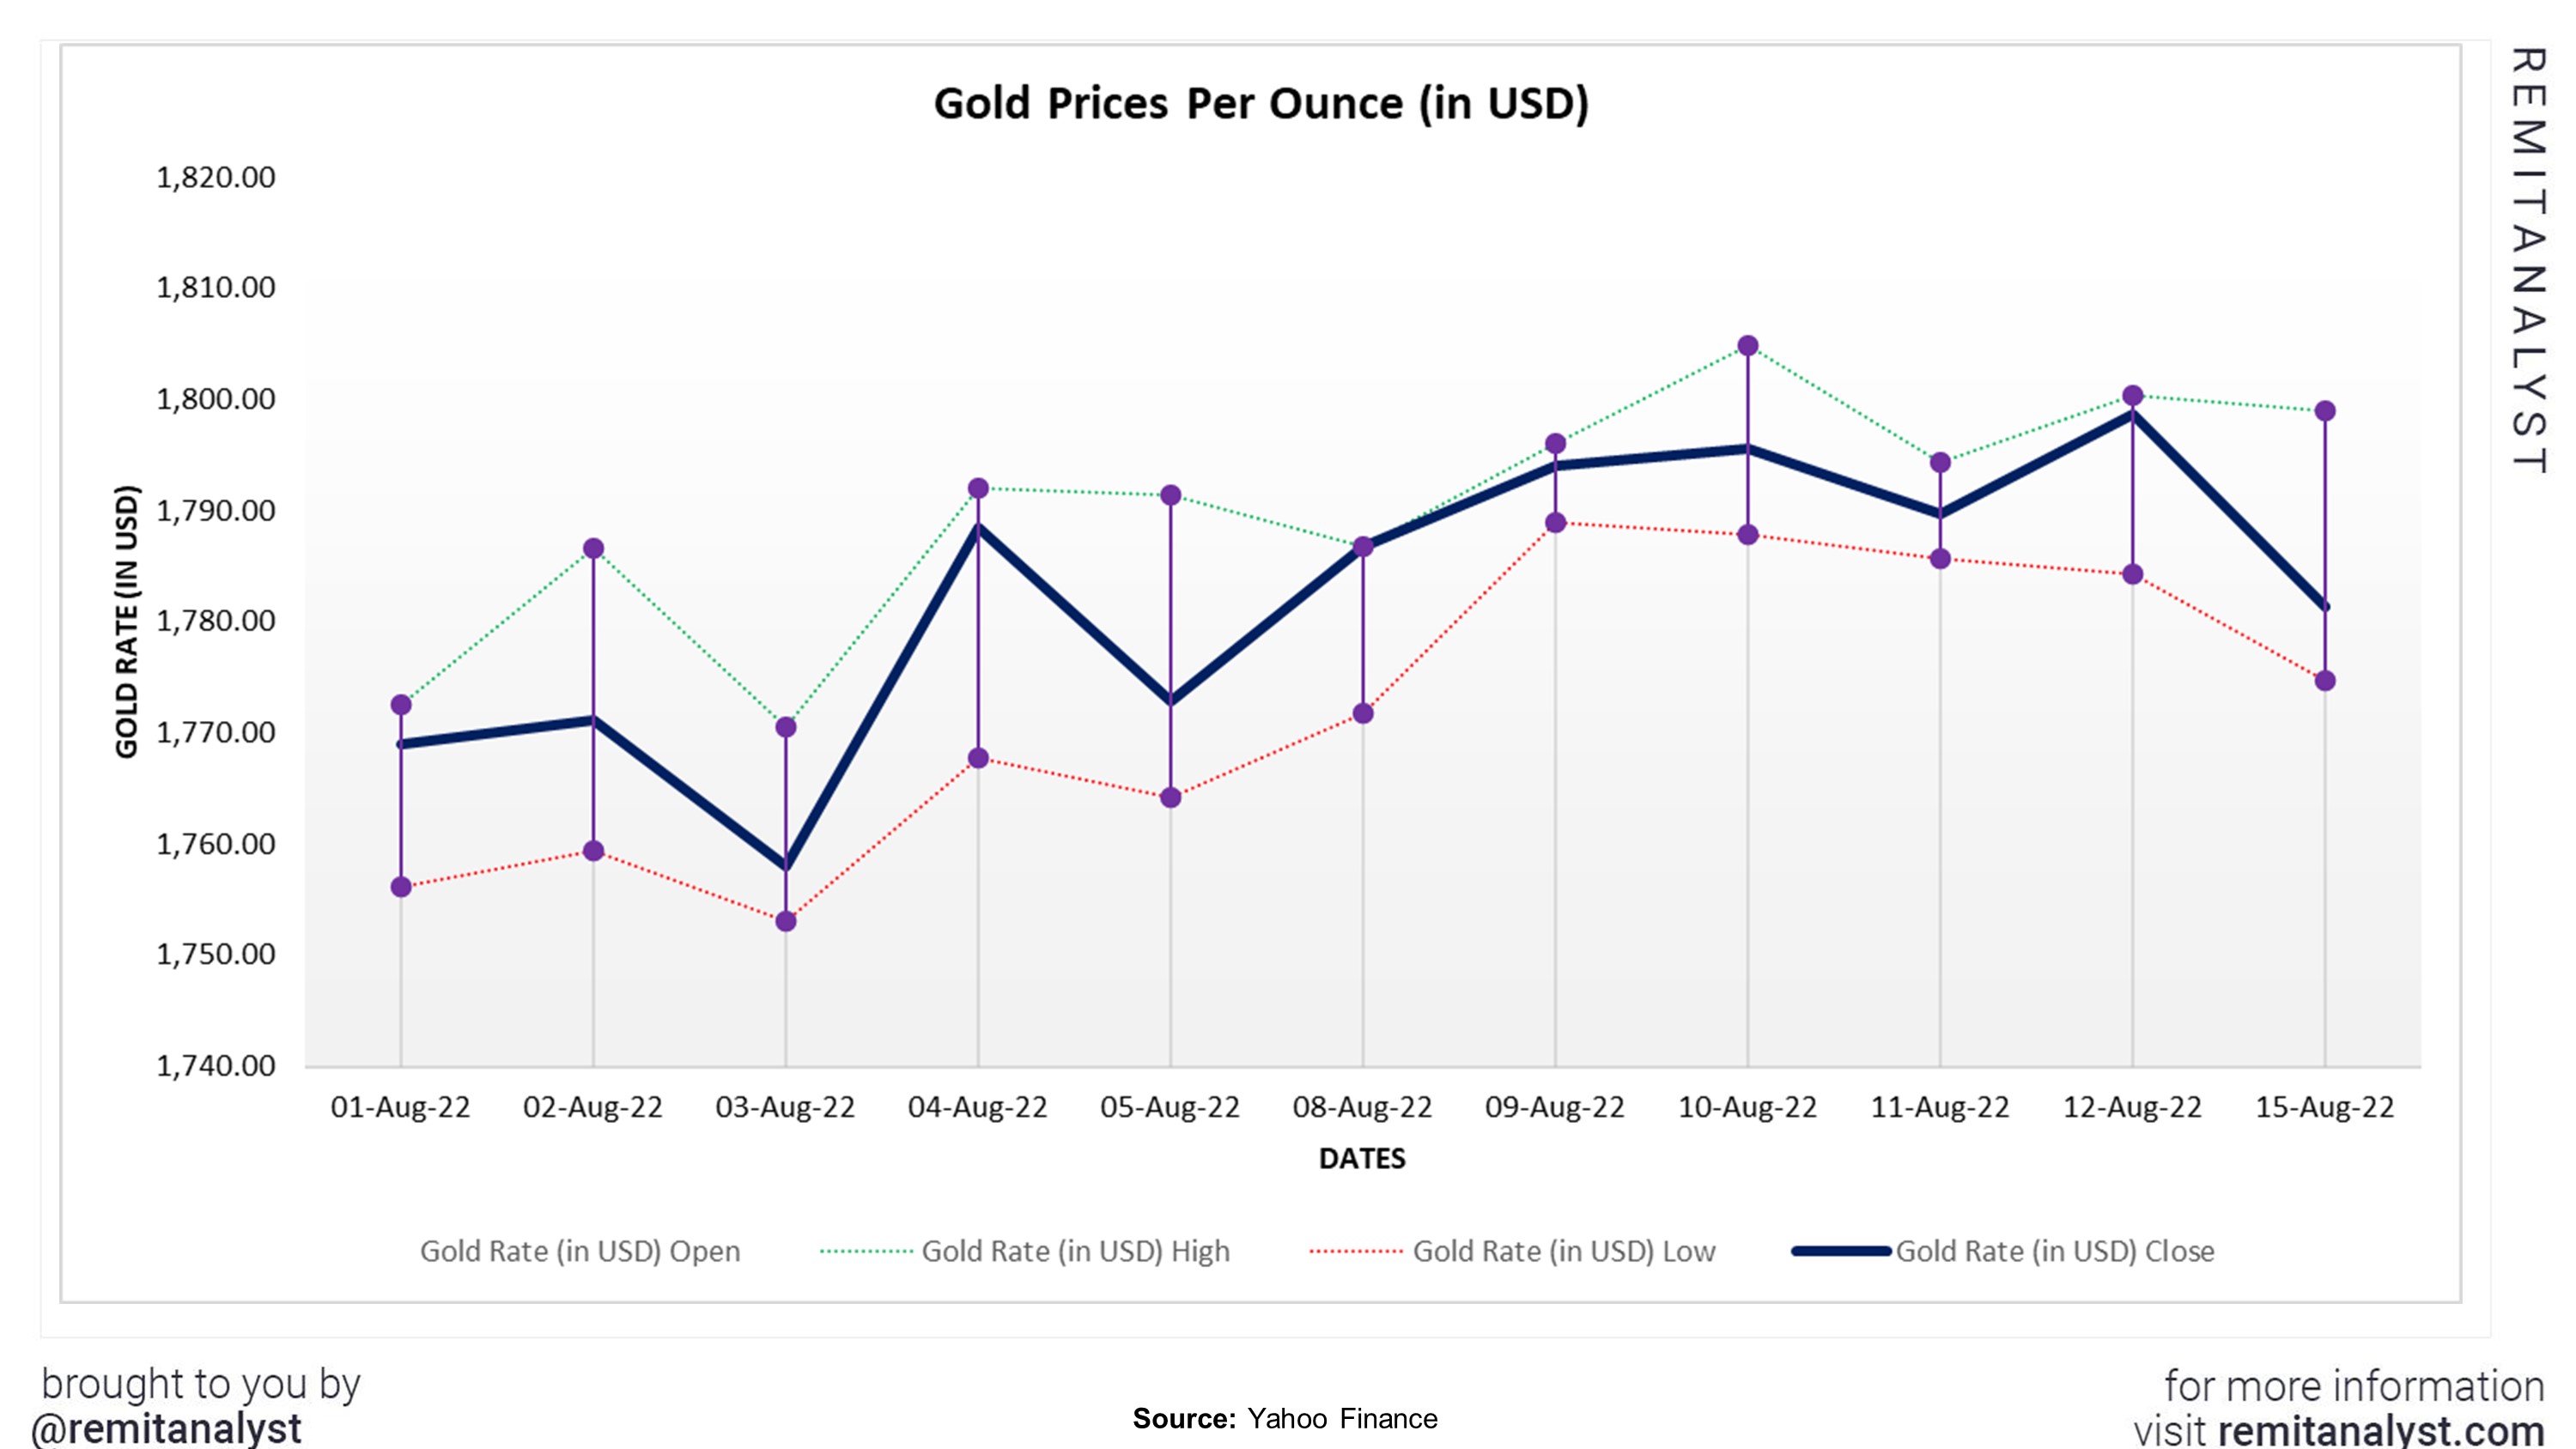
2. Gold imports
Gold is one of the preferred commodities of ordinary men and women. Ever since we have come out of the aftermath of the coronavirus pandemic, the demand for gold has increased. The demand increased by 43% from last year’s demand of 170.7 tonnes in the quarter through June. As of the 30th of June 2022, India imported about 306.2 tonnes of gold. This had severe repercussions in terms of inflation as it rose significantly over 7% in June 2022. The RBI decided to hike the gold import tax from 10.75% to 15% to try and curb the gold imports.
| Gold Rate (in USD) | ||||
|---|---|---|---|---|
| Date | Open | High | Low | Close |
| 01-Aug-22 | 1,763.90 | 1,772.50 | 1,756.10 | 1,769.00 |
| 02-Aug-22 | 1,772.10 | 1,786.60 | 1,759.40 | 1,771.10 |
| 03-Aug-22 | 1,756.70 | 1,770.50 | 1,753.00 | 1,758.00 |
| 04-Aug-22 | 1,769.40 | 1,792.10 | 1,767.70 | 1,788.50 |
| 05-Aug-22 | 1,791.20 | 1,791.40 | 1,764.20 | 1,772.90 |
| 08-Aug-22 | 1,771.80 | 1,786.80 | 1,771.80 | 1,786.80 |
| 09-Aug-22 | 1,790.00 | 1,796.10 | 1,789.00 | 1,794.00 |
| 10-Aug-22 | 1,804.40 | 1,804.90 | 1,787.80 | 1,795.60 |
| 11-Aug-22 | 1,794.30 | 1,794.30 | 1,785.70 | 1,789.70 |
| 12-Aug-22 | 1,786.30 | 1,800.40 | 1,784.30 | 1,798.60 |
| 15-Aug-22 | 1,799.00 | 1,799.00 | 1,774.70 | 1,781.40 |
Apart from this, the prices of gold have also increased. This has decreased the gold imports. On average, gold costs around $1780.73 per ounce. On the 10th of August 2022, gold price reached a high of $1804.70 per ounce and a low of $1753.00 on the 3rd of August 2022. The more the gold imports, the higher the inflation rates, and the lower the currency’s value. If the public stop buying gold, it should help the money.
3. GDP & Import/Export
The import-export balance and the gross domestic product (GDP) affect the currency’s value. All country imports and export goods. When the exports are higher than the imports, the value of the currency increases. On the other hand, when the imports are higher than the exports, the currency’s value decreases. The GDP, however, depends on consumer spending and consumption rates. When the currency’s buying power decreases, the GDP devalues the currency.
| India: Imports & Exports (in US$ Million) | ||||
|---|---|---|---|---|
| Date | Export (US$ Million) | Import (US$ Million) | ||
| Jun-21 | 20.30 | 10.84 | ||
| Jul-21 | 19.36 | 11.39 | ||
| Aug-21 | 20.46 | 11.87 | ||
| Sep-21 | 21.61 | 12.58 | ||
| Oct-21 | 19.85 | 11.61 | ||
| Nov-21 | 20.14 | 12.59 | ||
| Dec-21 | 25.31 | 14.89 | ||
| Jan-22 | 21.63 | 13.24 | ||
| Feb-22 | 21.30 | 12.97 | ||
| Mar-22 | 26.95 | 15.35 | ||
| Apr-22 | 22.59 | 14.05 | ||
| May-22 | 23.61 | 15.20 | ||
| Jun-22 | 25.29 | 15.77 | ||
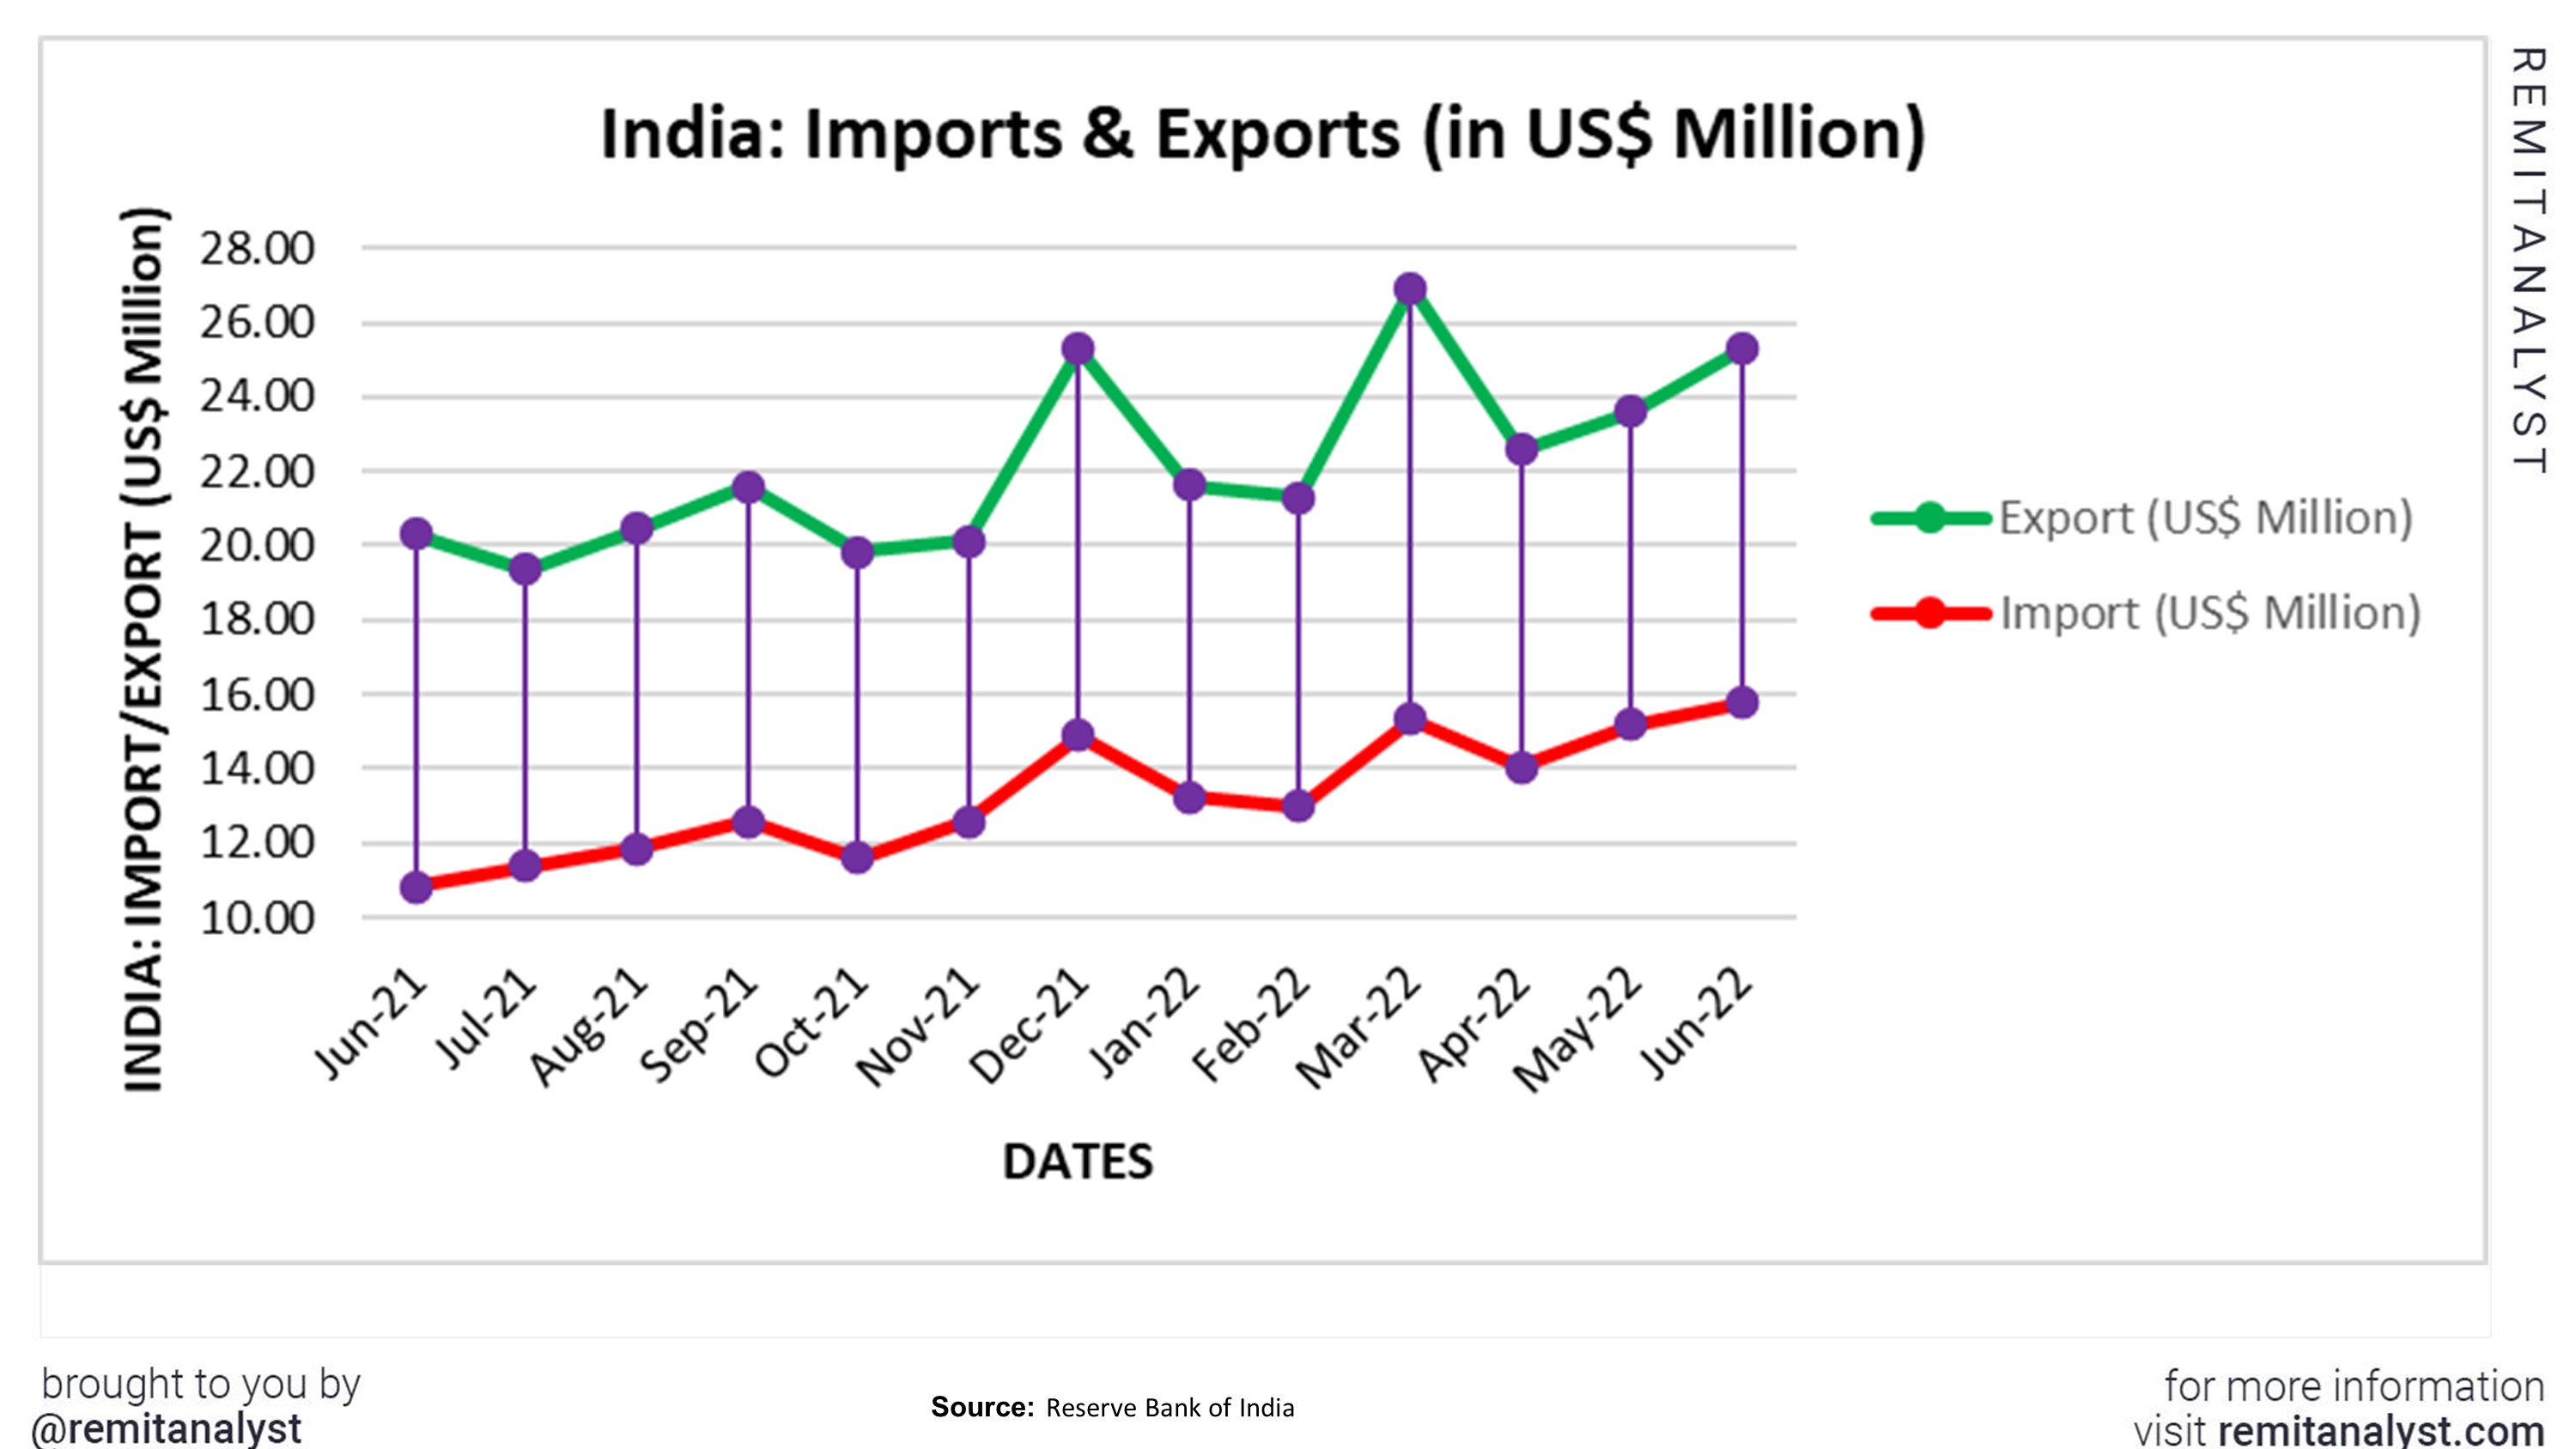
The graph below shows that the trade deficit gap has been widening unpredictably. From April 2022 to June 2022, the imports and exports had a linear growth making an almost negligible difference in the trade deficit. India had a deficit of $8.411M in May 2022. it has increased to $9.525M in June 2022, which poses a worrying sign.
| India: GDP Rate | ||||
|---|---|---|---|---|
| Date | Rate (%) | |||
| Jul-19 | 6.25% | |||
| Aug-19 | 6.00% | |||
| Jun-19 | 5.75% | |||
| Aug-19 | 5.40% | |||
| Oct-19 | 5.15% | |||
| Mar-20 | 4.40% | |||
| May-20 | 4.00% | |||
| May-22 | 4.40% | |||
| Jun-22 | 4.90% | |||
| Jul-22 | 13.50% | |||
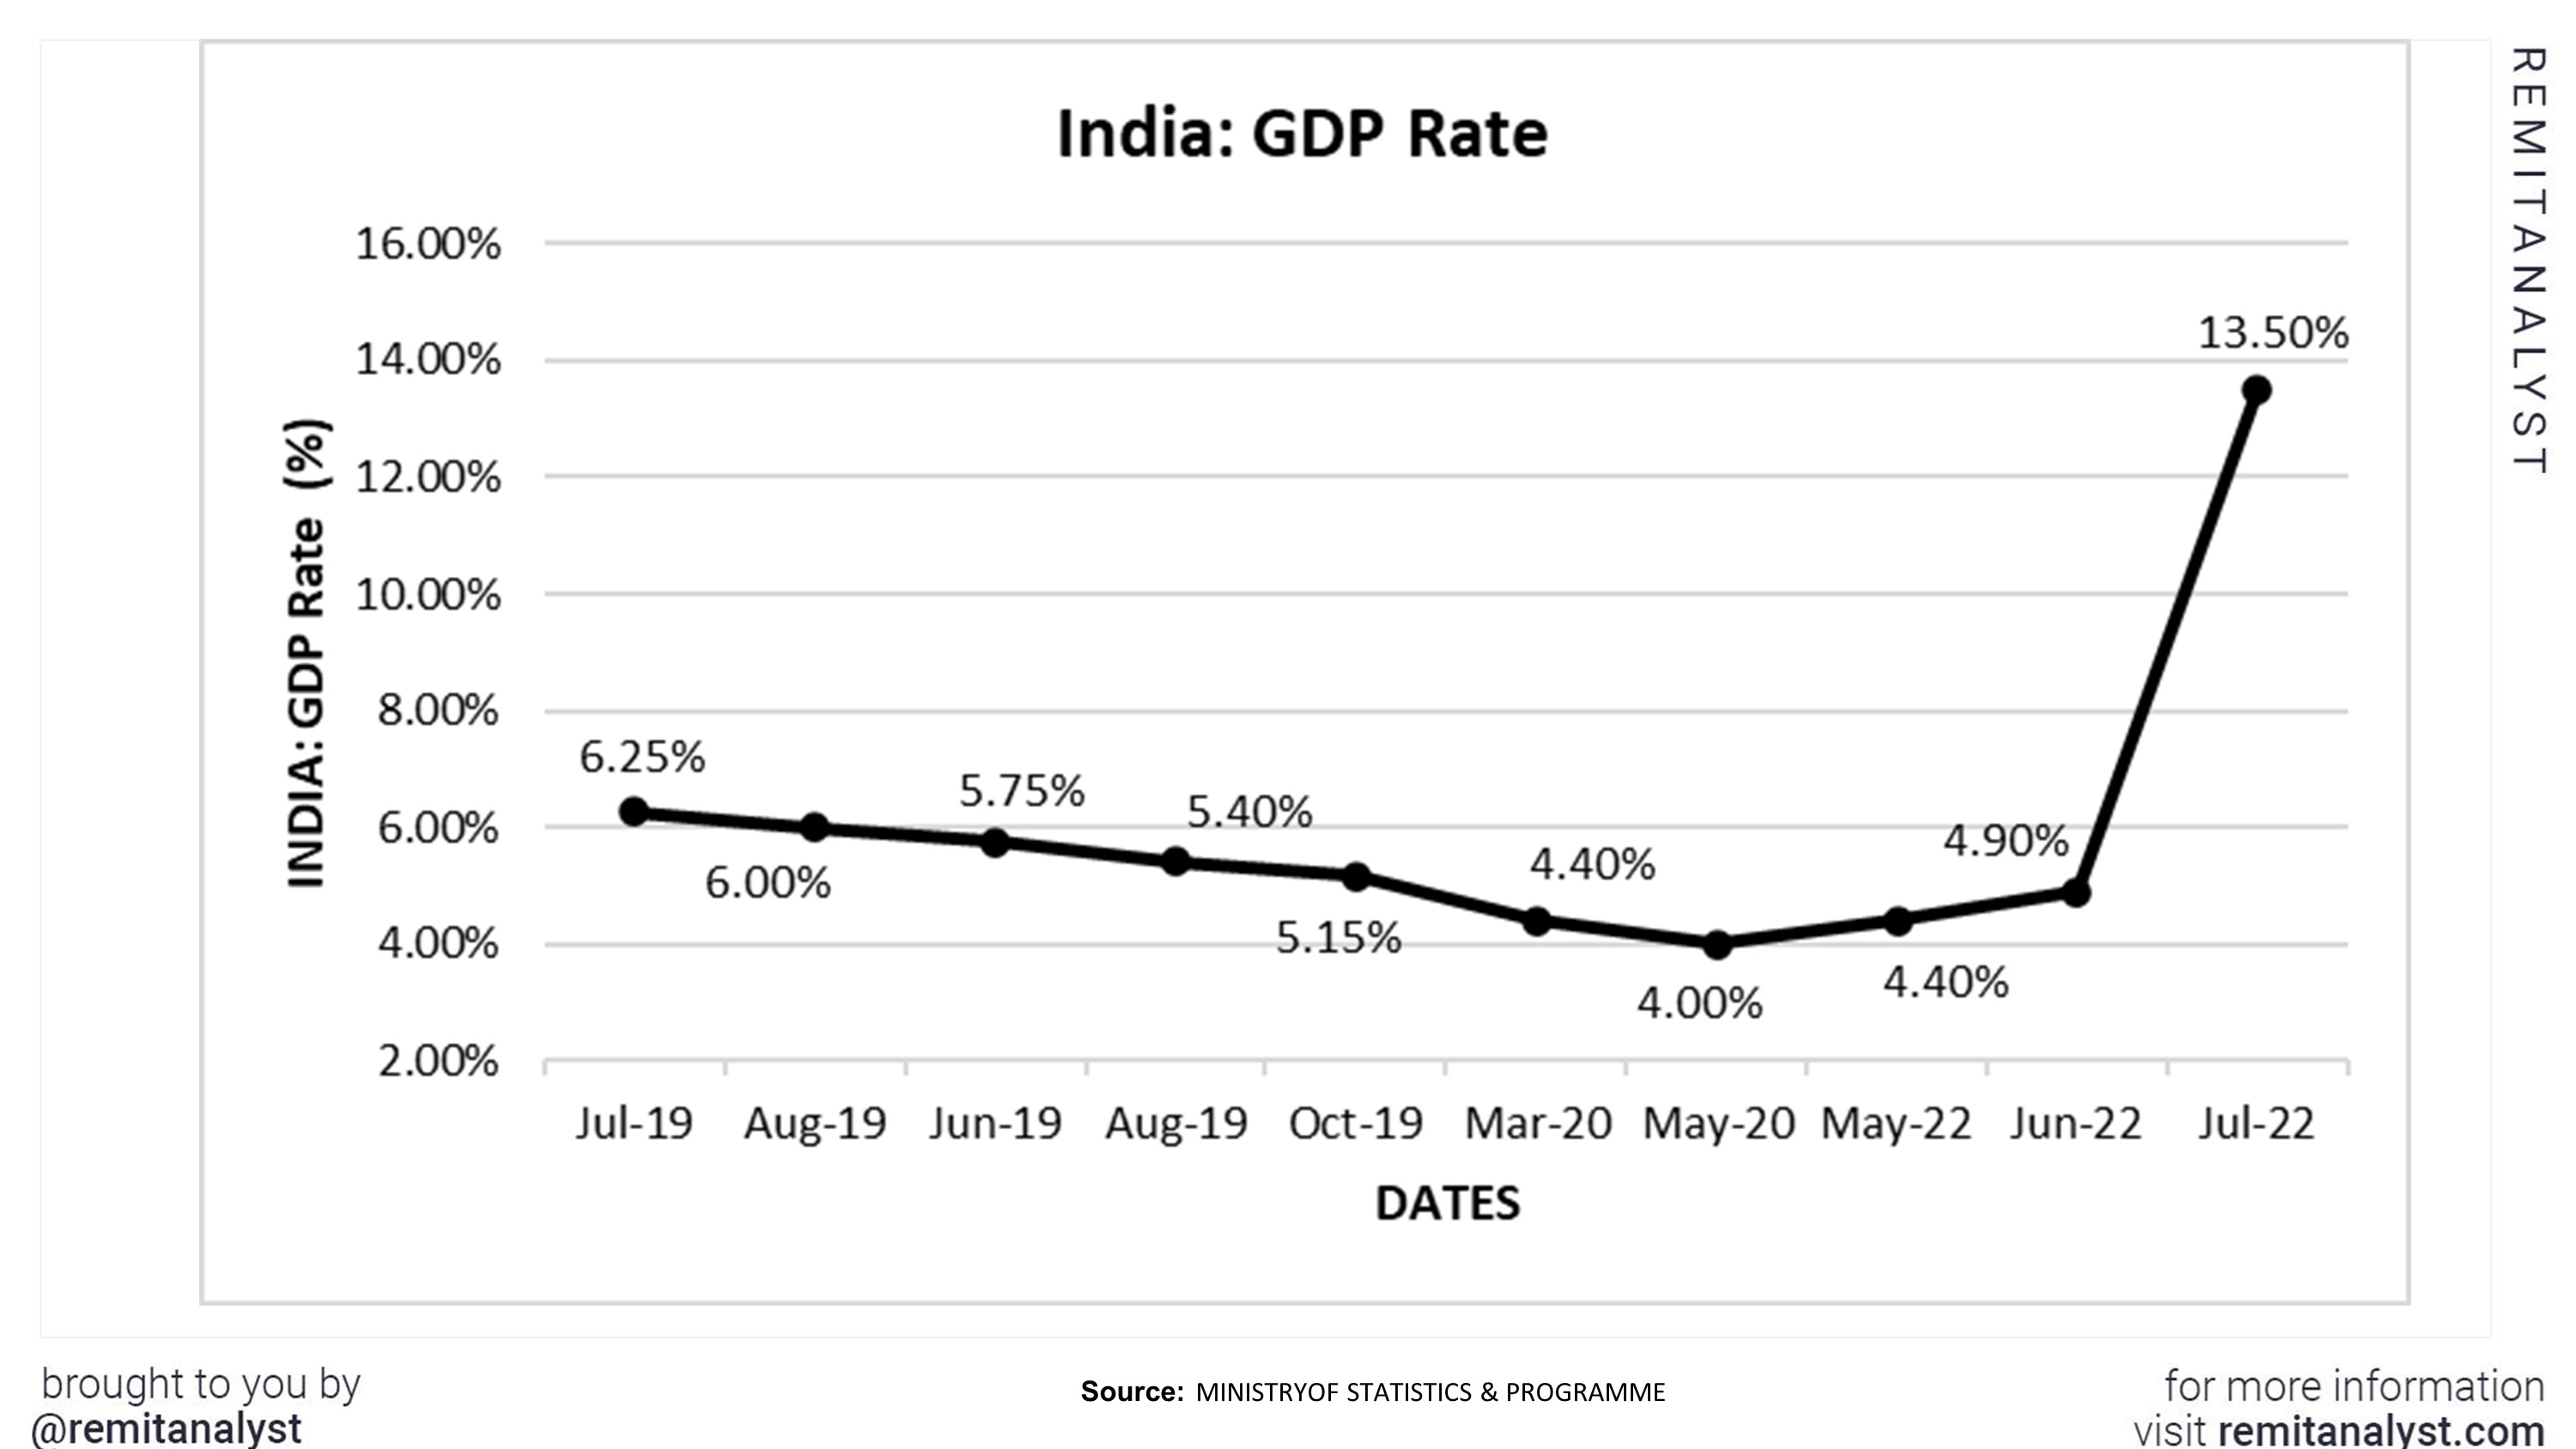
The currency’s buying power has decreased significantly. However, it is performing better than it did in July. The graph above suggests that the GDP has been increasing instead of declining, which is a good sign. The GDP has risen from 4.4% in May 2022 to 4.9% in June 2022. However, this growth is slow. The Indian government and the RBI aim to recover and restore GDP rates by 2023. This seems like a positive sign for the country’s economy and currency.
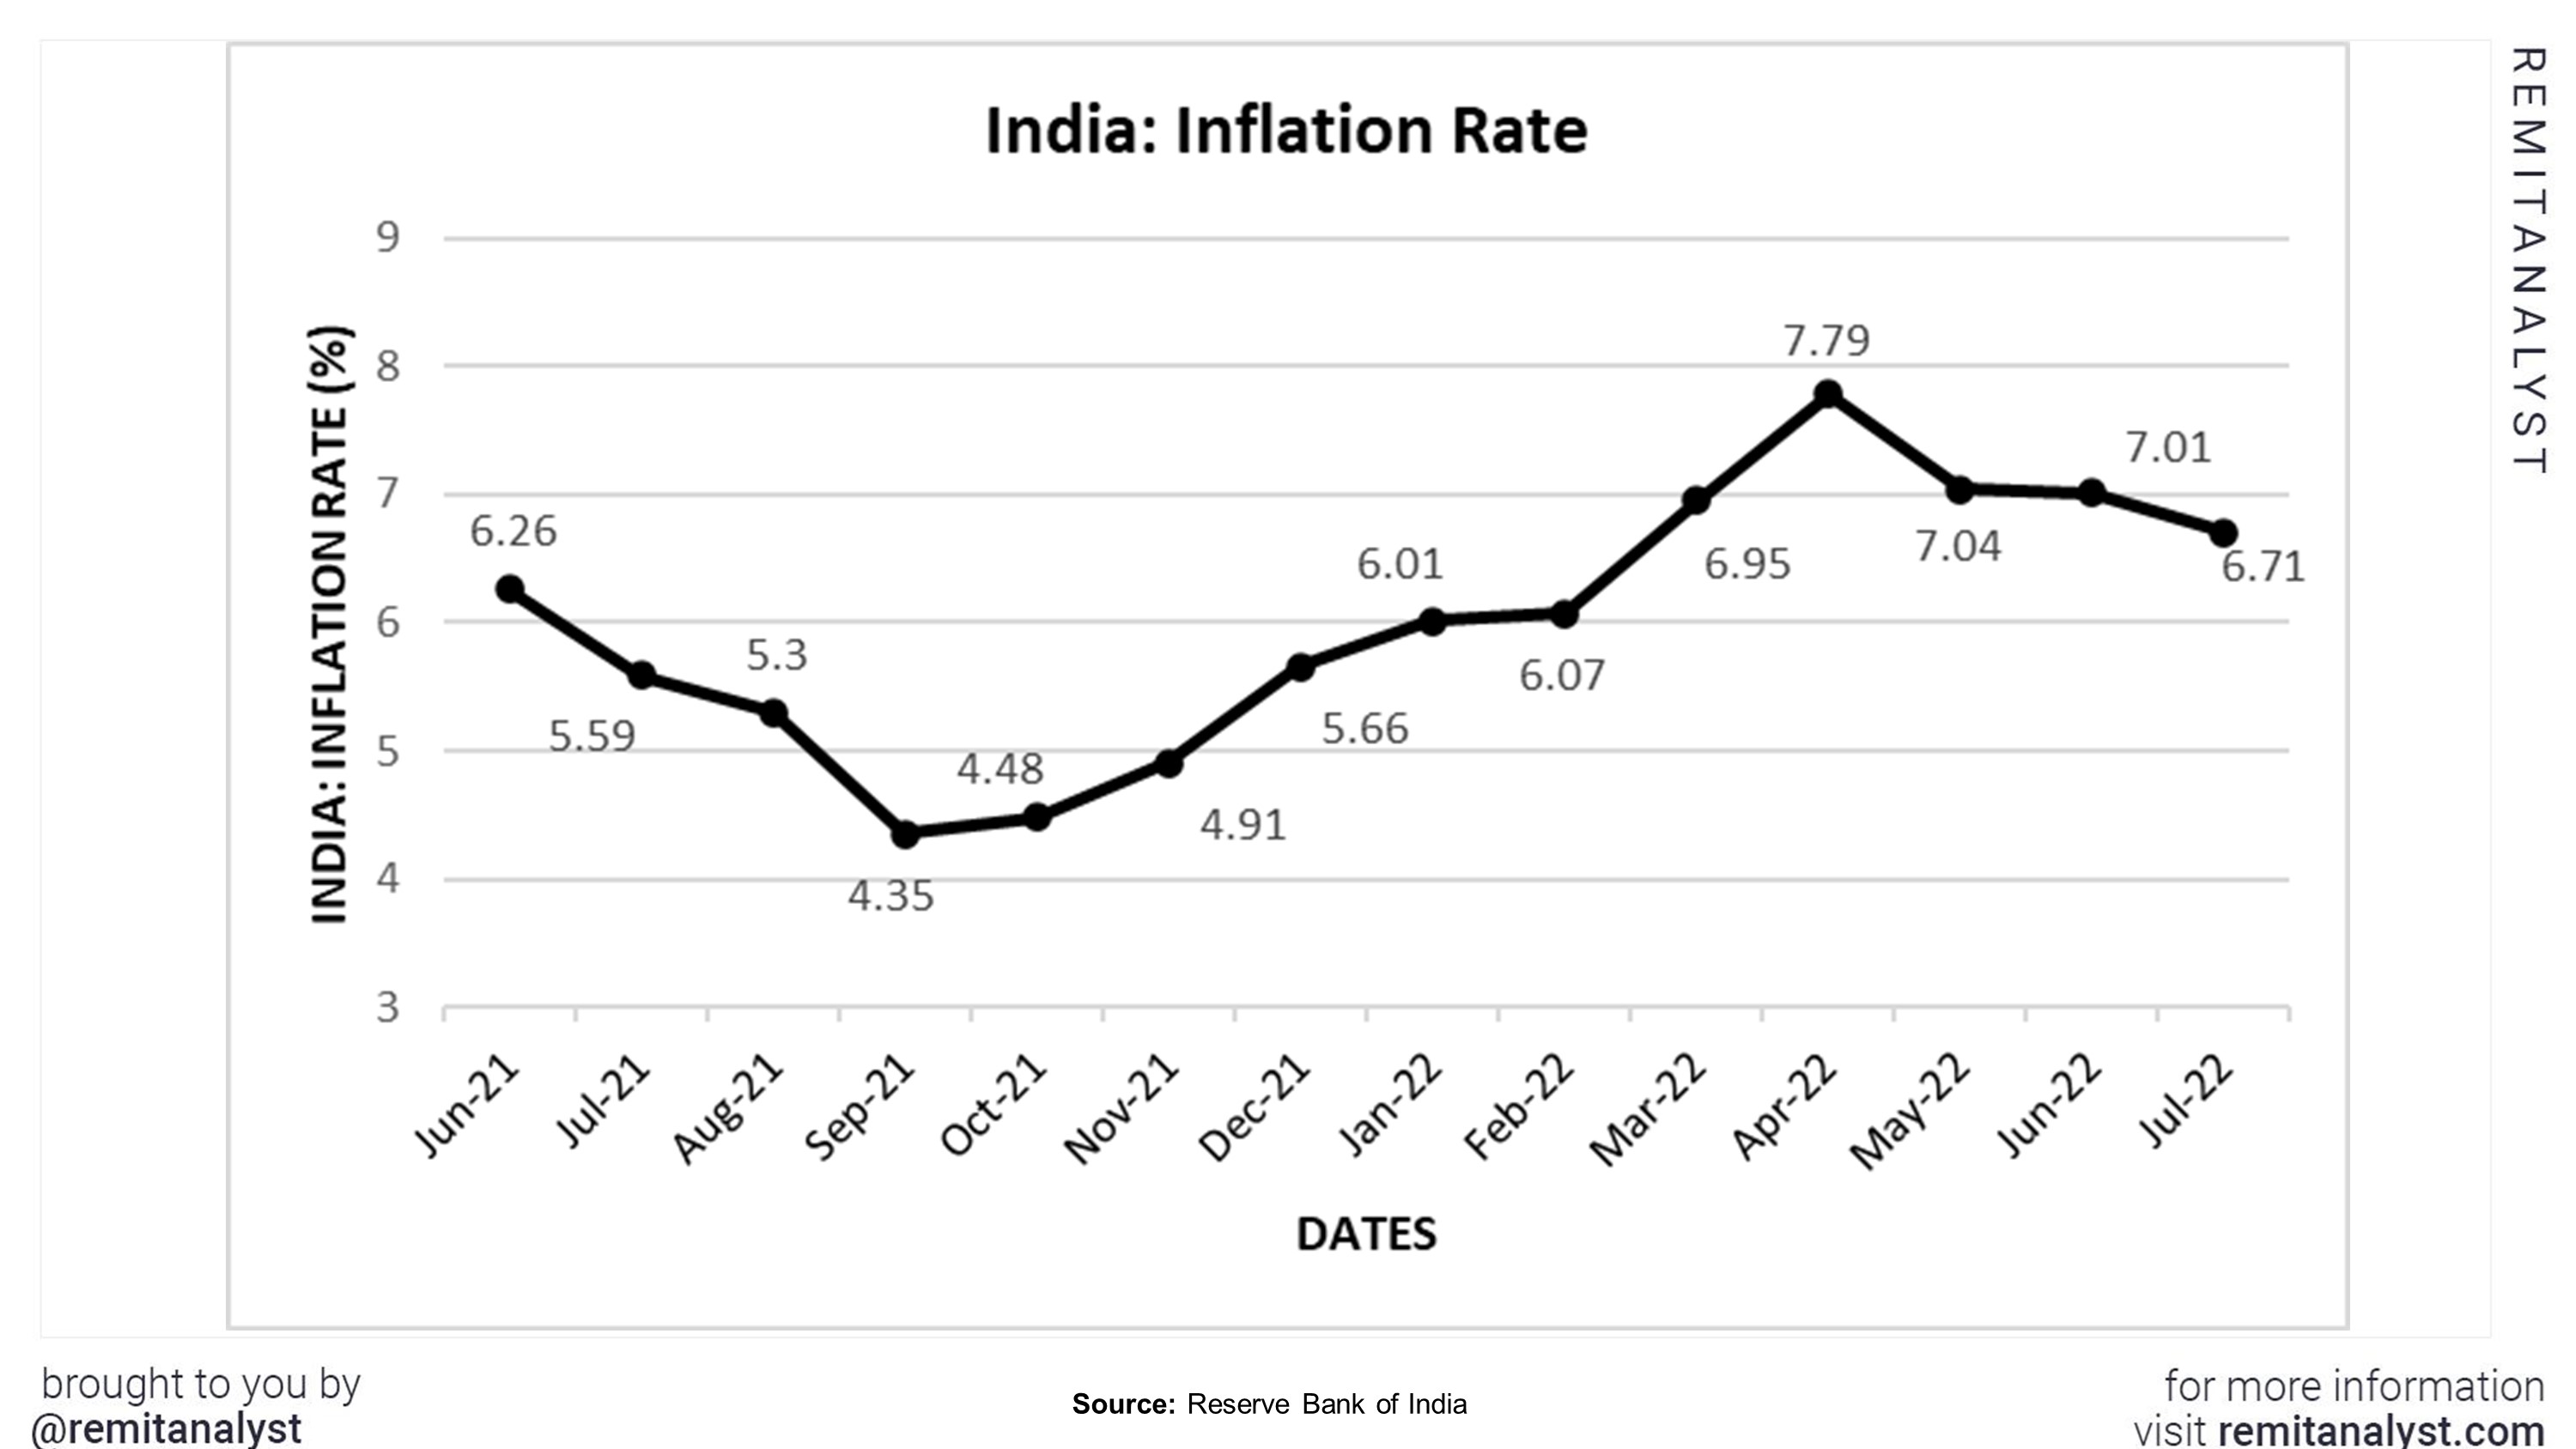
4. Inflation rates
Inflation increases with a decrease in GDP. A rise in inflation also decreases the purchasing power of the currency. Reducing inflation rates suggests that the country’s economy and currency are performing relatively well. From the data below, one can infer that the inflation rates will significantly increase in 2022.
| India's Inflation rates | ||||
|---|---|---|---|---|
| Date | Percentage | |||
| Jun-21 | 6.26 | |||
| Jul-21 | 5.59 | |||
| Aug-21 | 5.3 | |||
| Sep-21 | 4.35 | |||
| Oct-21 | 4.48 | |||
| Nov-21 | 4.91 | |||
| Dec-21 | 5.66 | |||
| Jan-22 | 6.01 | |||
| Feb-22 | 6.07 | |||
| Mar-22 | 6.95 | |||
| Apr-22 | 7.79 | |||
| May-22 | 7.04 | |||
| Jun-22 | 7.01 | |||
| Jul-22 | 6.71 | |||
However, since May 2022, the inflation rates have started to decrease. The inflation rate has reduced from 7.01% in June 2022 to 6.71% in July 2022. This seems to be a good sign. The currency’s performance against the dollar compared to that in July reflects the efforts of the government and the RBI.
| US Inflation rates | ||||
|---|---|---|---|---|
| Date | Percentage | |||
| Jun-21 | 5.4 | |||
| Jul-21 | 5.4 | |||
| Aug-21 | 5.3 | |||
| Sep-21 | 5.4 | |||
| Oct-21 | 6.2 | |||
| Nov-21 | 6.8 | |||
| Dec-21 | 7 | |||
| Jan-22 | 7.5 | |||
| Feb-22 | 7.9 | |||
| Mar-22 | 8.5 | |||
| Apr-22 | 8.3 | |||
| May-22 | 8.6 | |||
| Jun-22 | 9.1 | |||
| Jul-22 | 8.5 | |||
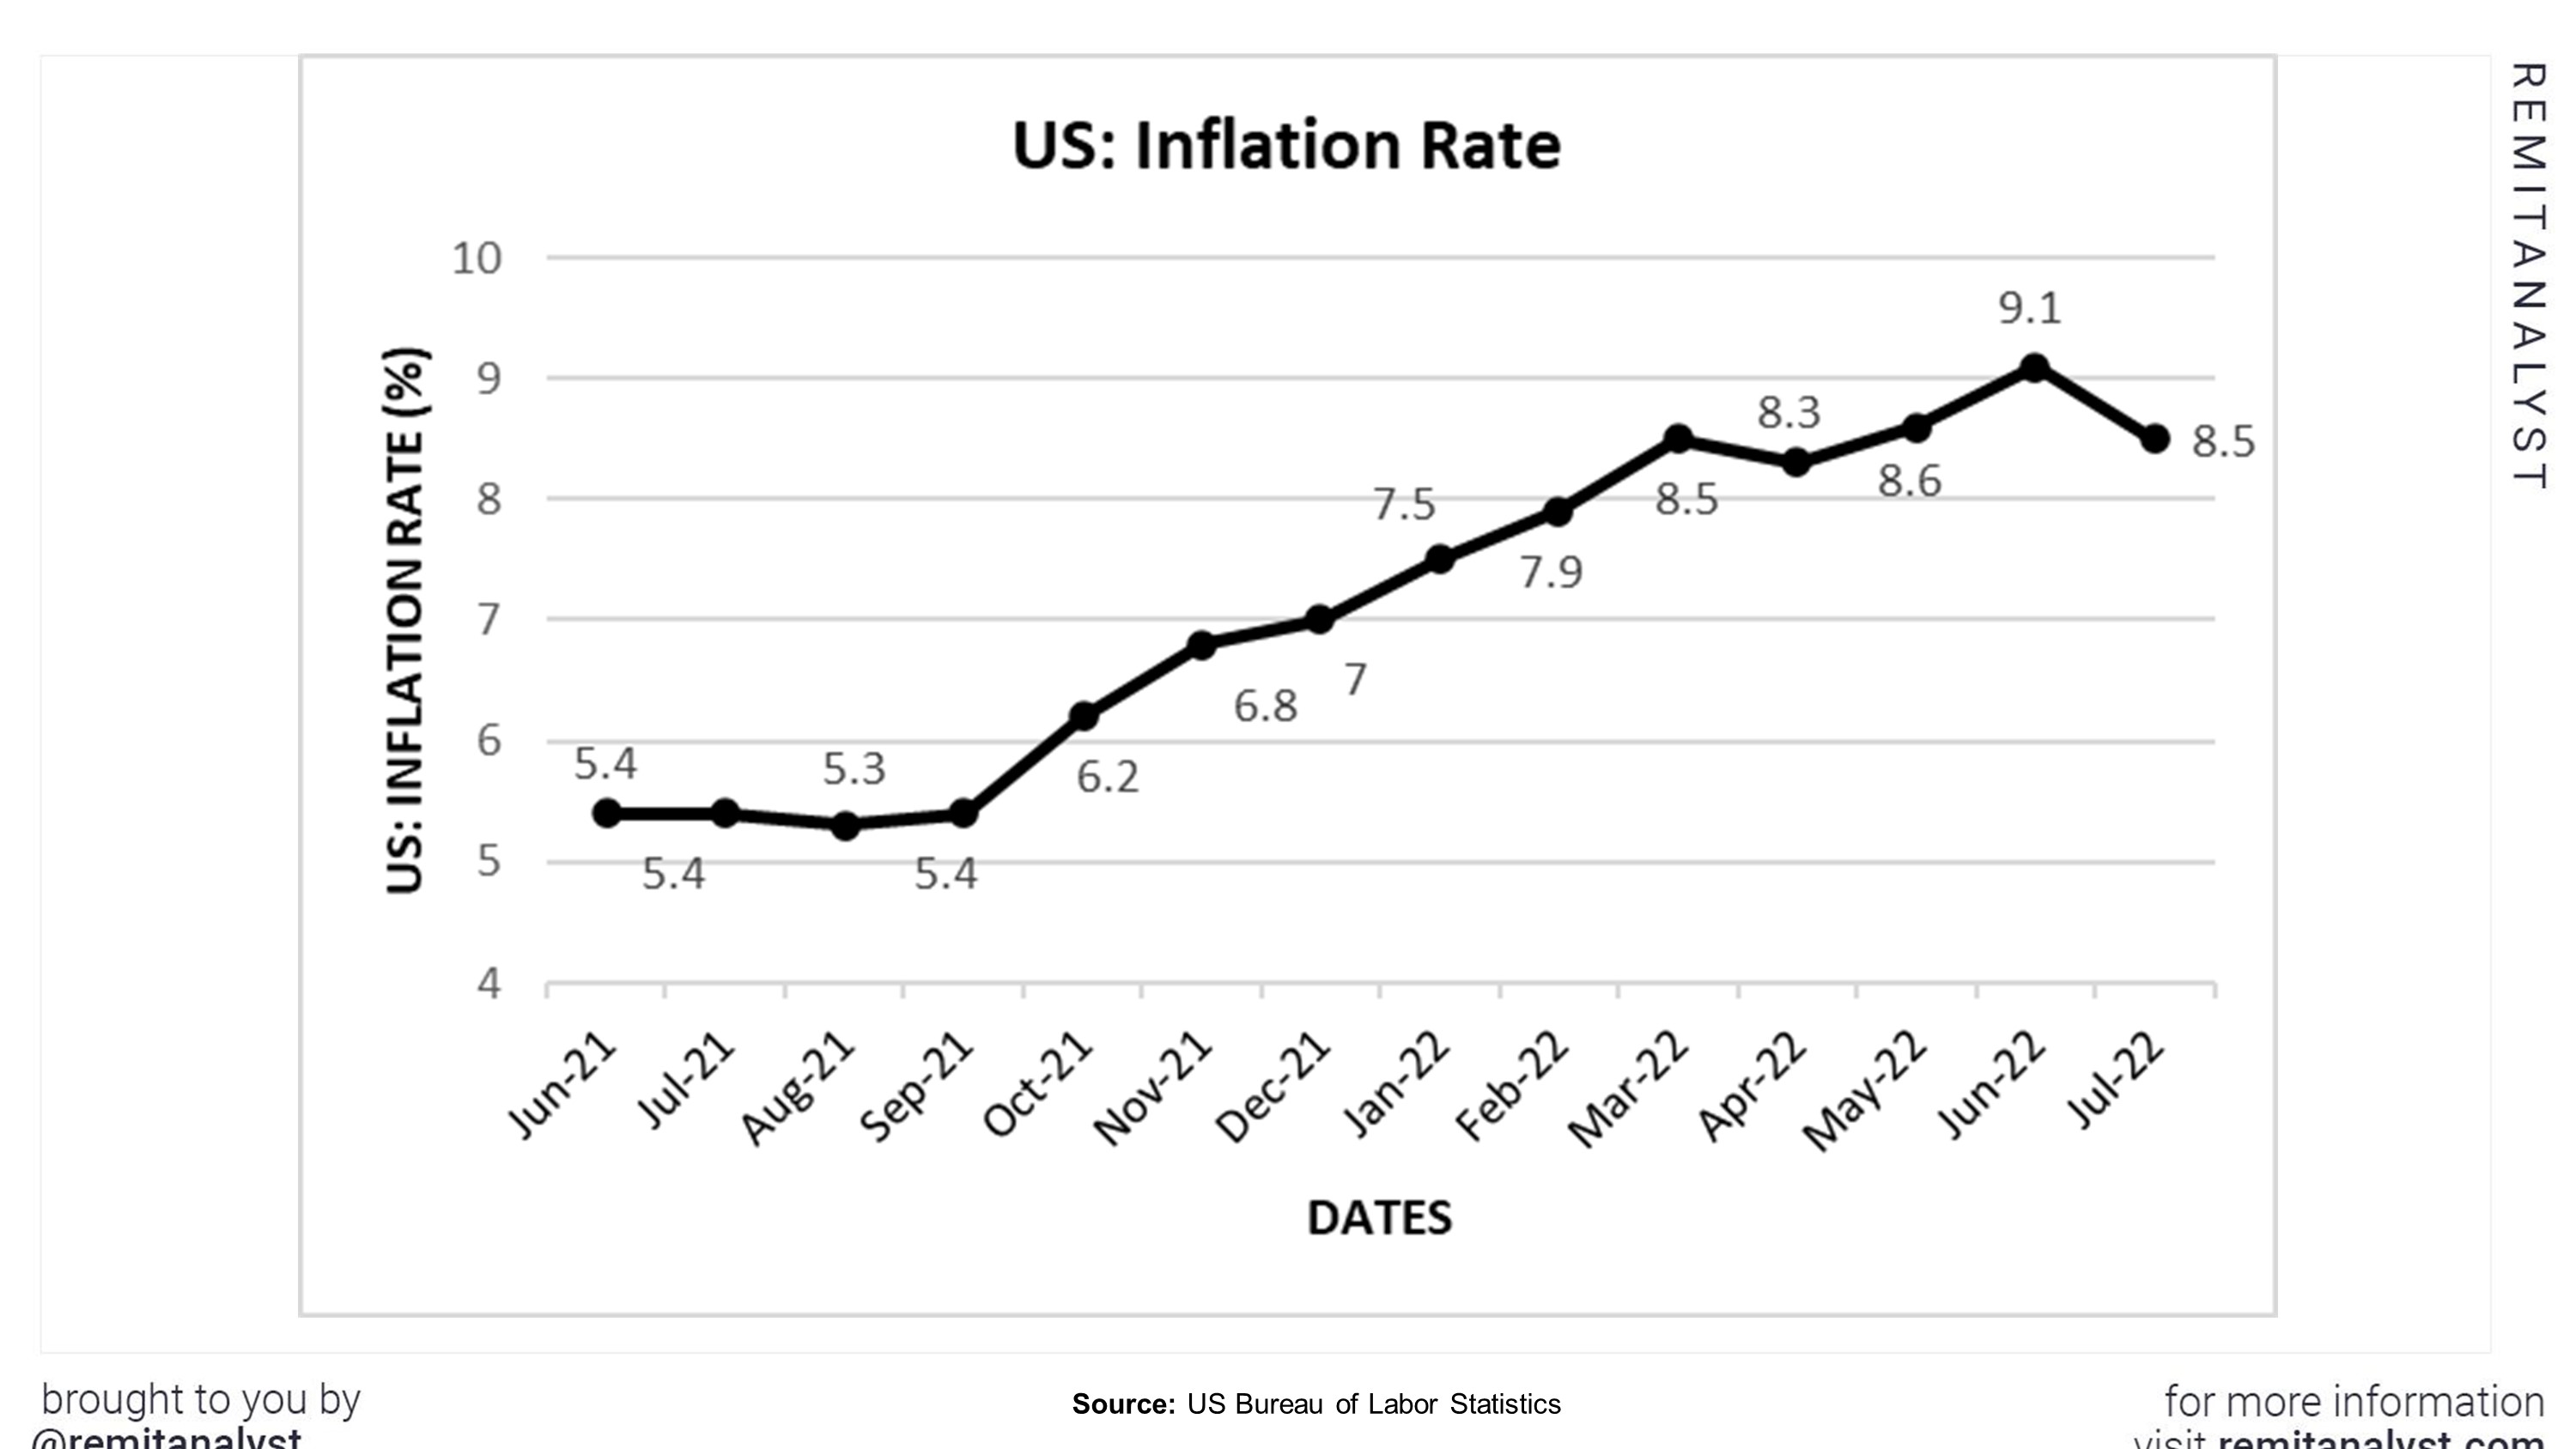
The US also experiences inflation just like any other country. The inflation rates in the US have been increasing since September 2021. It hit an all-time high of 9.1% in June 2022. However, the inflation rate decreased to 8.5% in July 2022. The US Federal Reserve has taken measures such as increasing the repo rates by 75 basis points to help curb the inflation rates. The repo rates are expected to increase until the inflation rates return to their normal range.
5. Interest rates
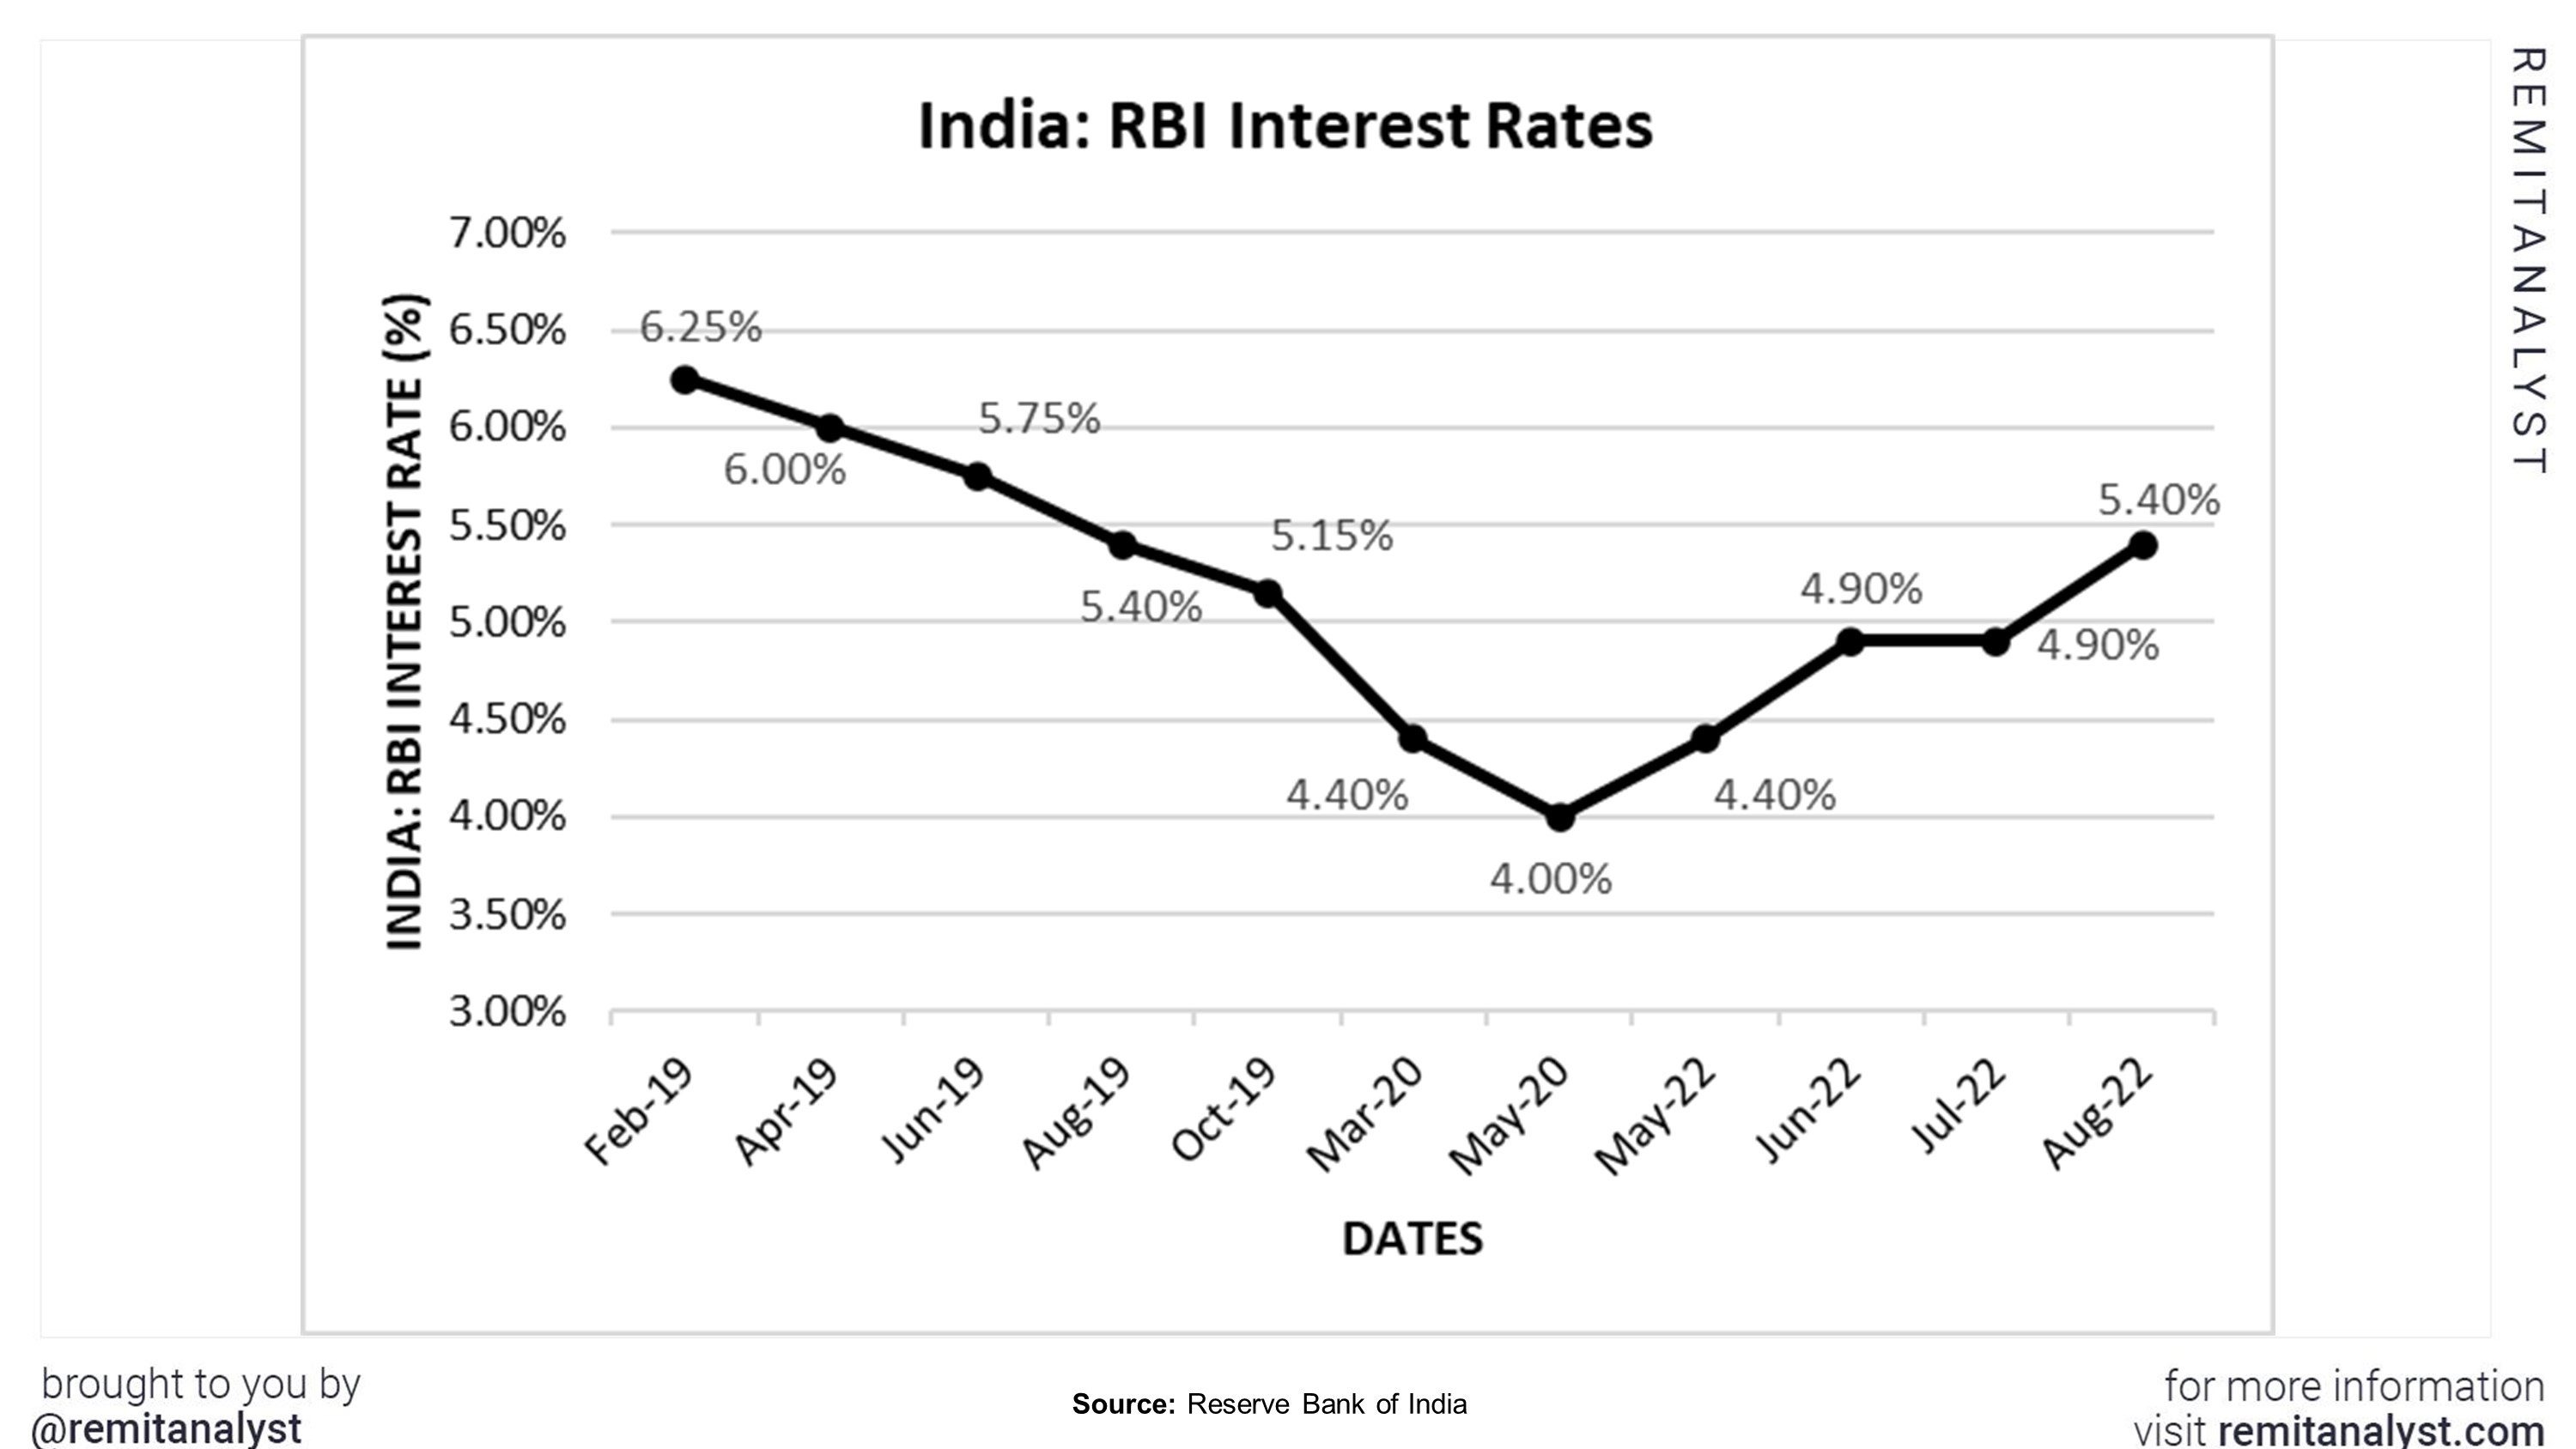
The RBI has several tricks up the sleeve to help curb the inflation rates. One such trick is increasing or decreasing the interest rate. An increase in these rates leads to an increase in the lending and borrowing rates, which may pose an obstacle to overseas funding. It also leads to a rise in banks’ borrowing and lending rates. It is believed that the higher the interest rates, the higher the cash inflow, which helps bolster the country’s economic stability. The interest rates hit an all-time low of 4% in 2020. However, the interest rates have been increasing ever since. As of August 2022, the repo rate has been increased to 5.4%. The RBI is expected to increase the interest rates by 50 bases to 5.9% by the end of this year.
| India: RBI Interest Rates | ||||
|---|---|---|---|---|
| Date | Rate (%) | |||
| Feb-19 | 6.25% | |||
| Apr-19 | 6.00% | |||
| Jun-19 | 5.75% | |||
| Aug-19 | 5.40% | |||
| Oct-19 | 5.15% | |||
| Mar-20 | 4.40% | |||
| May-20 | 4.00% | |||
| May-22 | 4.40% | |||
| Jun-22 | 4.90% | |||
| Jul-22 | 4.90% | |||
| Aug-22 | 5.40% | |||
The US Federal Reserve, the central bank of the US, also takes precautionary methods to help increase the performance of the US dollar.
| US Fed Interest Rates | ||||
|---|---|---|---|---|
| Date | Interest Rate | |||
| Jun-21 | 0.08 | |||
| Jul-21 | 0.10 | |||
| Aug-21 | 0.09 | |||
| Sep-21 | 0.08 | |||
| Oct-21 | 0.08 | |||
| Nov-21 | 0.08 | |||
| Dec-21 | 0.08 | |||
| Jan-22 | 0.08 | |||
| Feb-22 | 0.08 | |||
| Mar-22 | 0.20 | |||
| Apr-22 | 0.33 | |||
| May-22 | 0.77 | |||
| Jun-22 | 1.21 | |||
| Jul-22 | 1.58 | |||
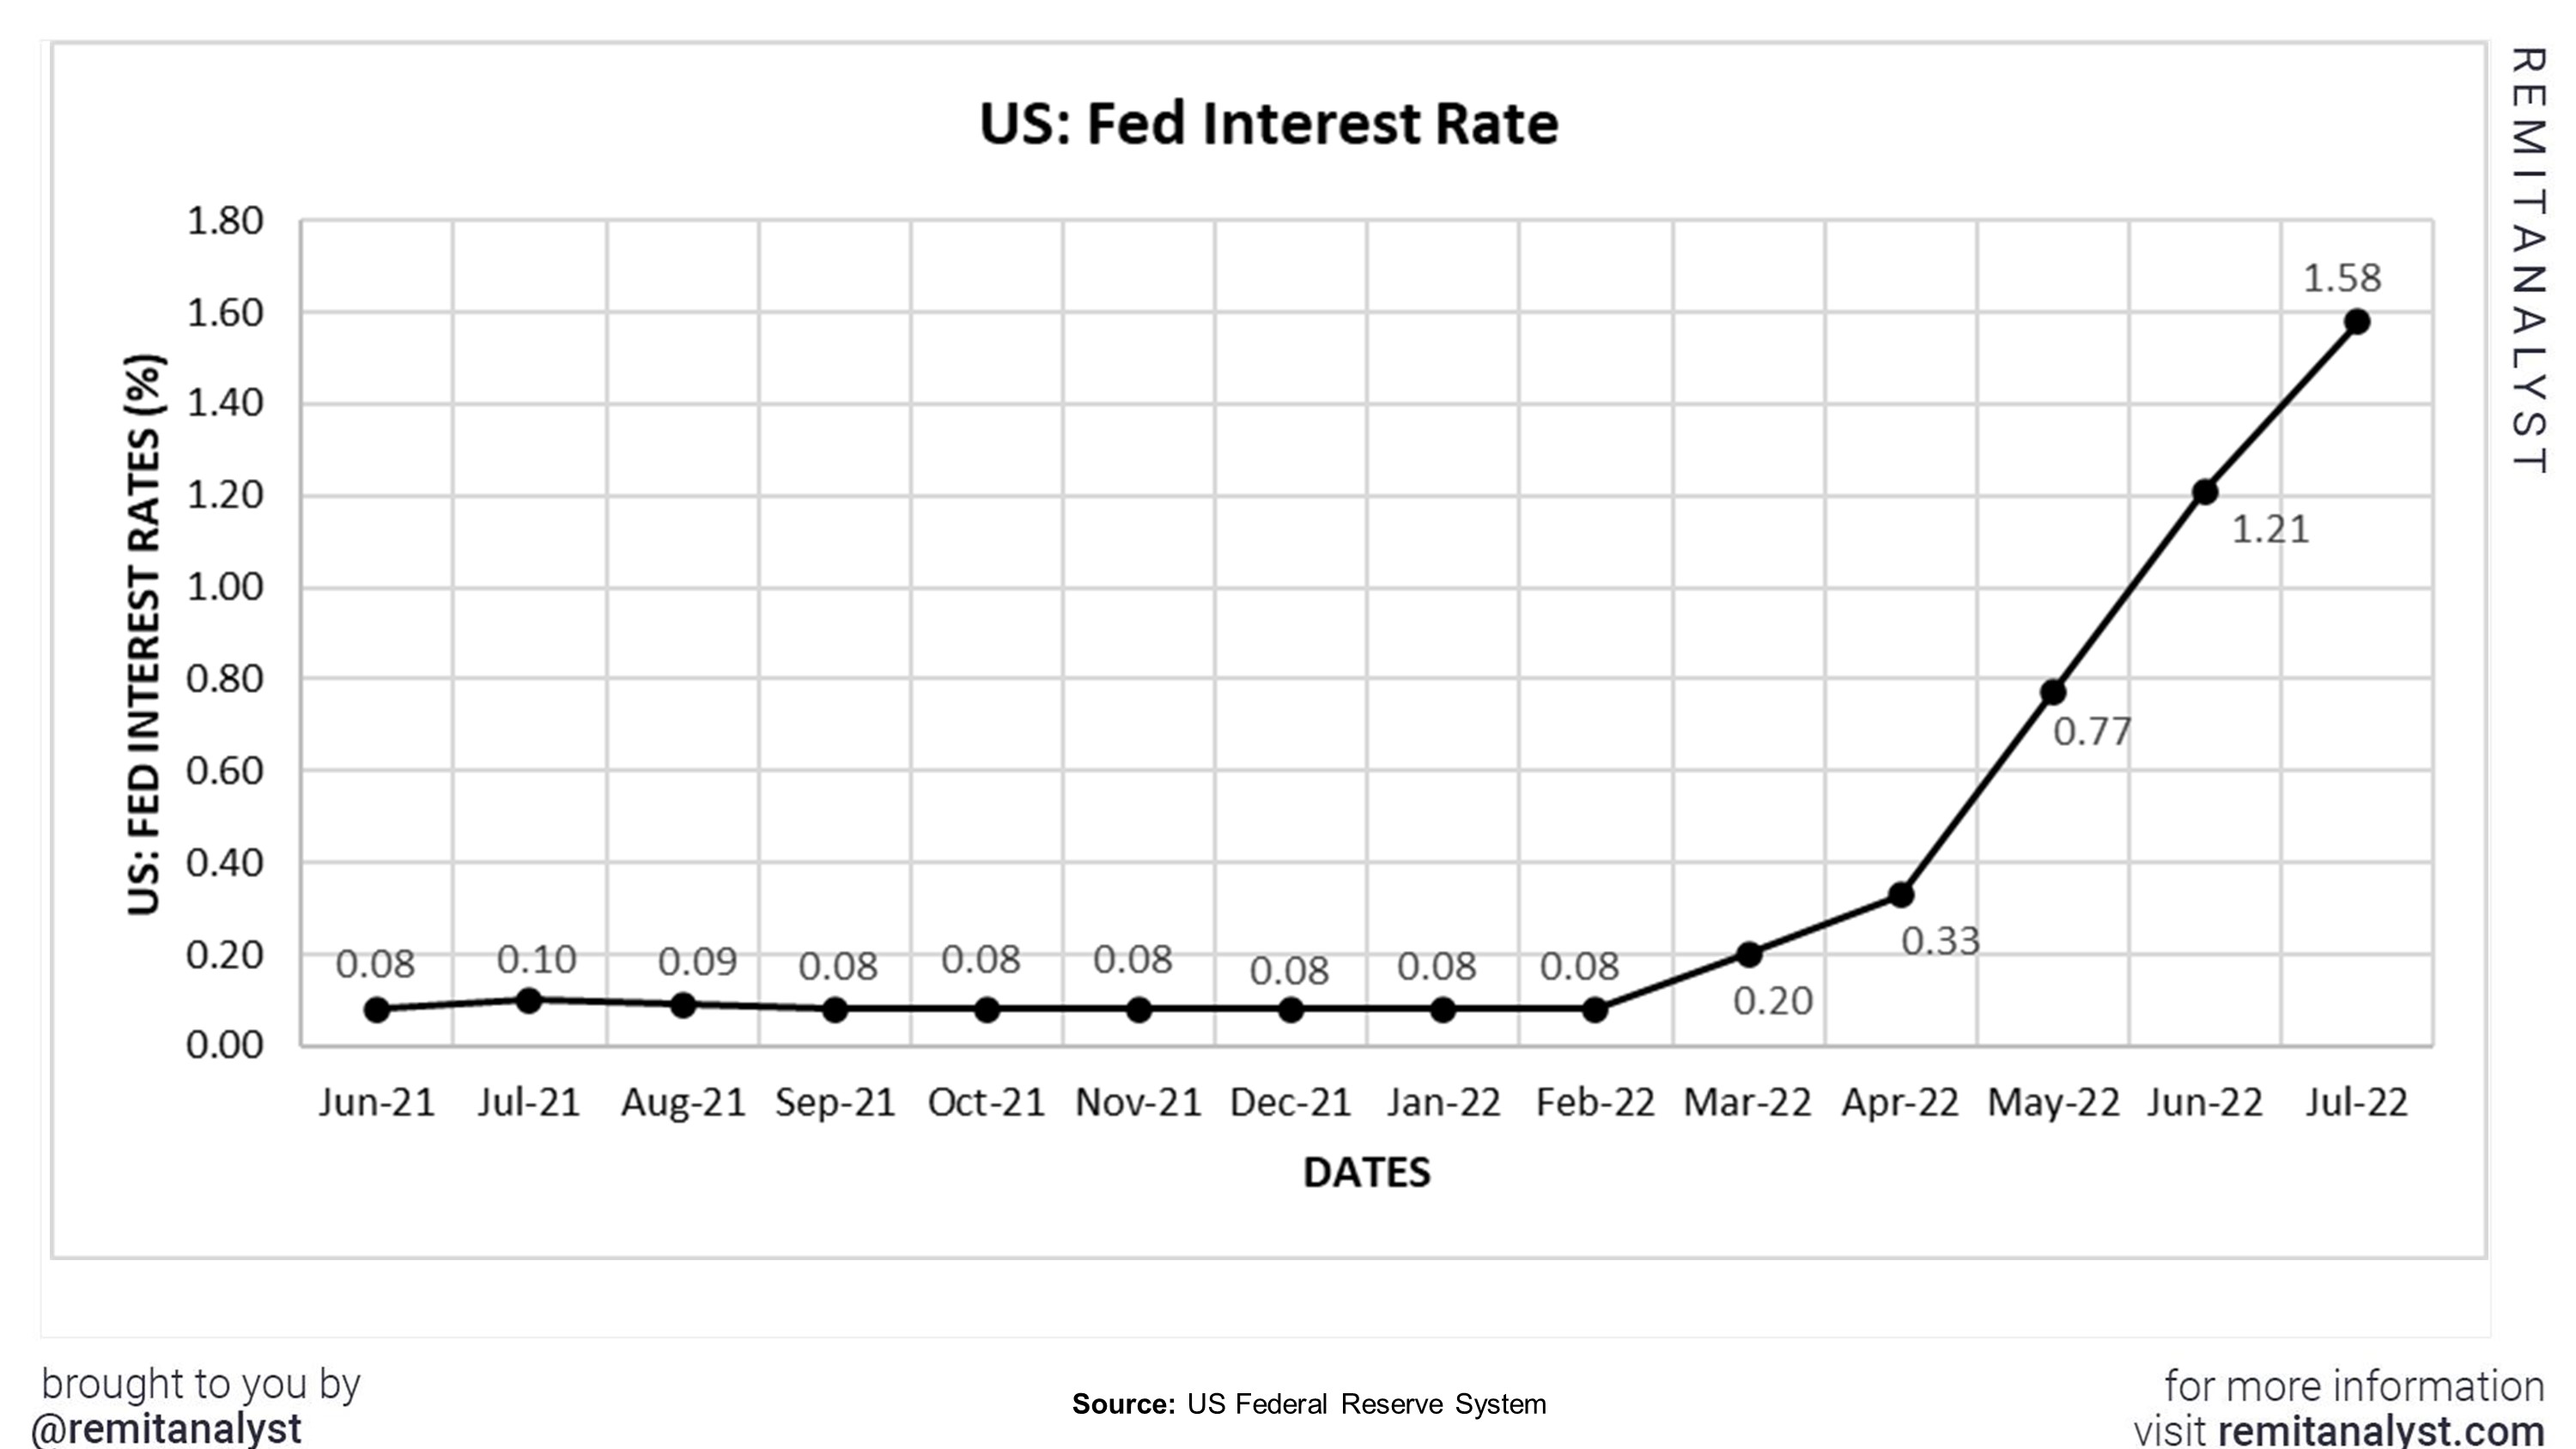
The Fed also raised the repo rates by 75 basis points in July to help curb inflation. The decrease in the inflation rate from June to July suggests that this increase in the repo rate worked. This contrasting performance of India and the US in these factors has led to such poor performance of the rupee against the dollar.
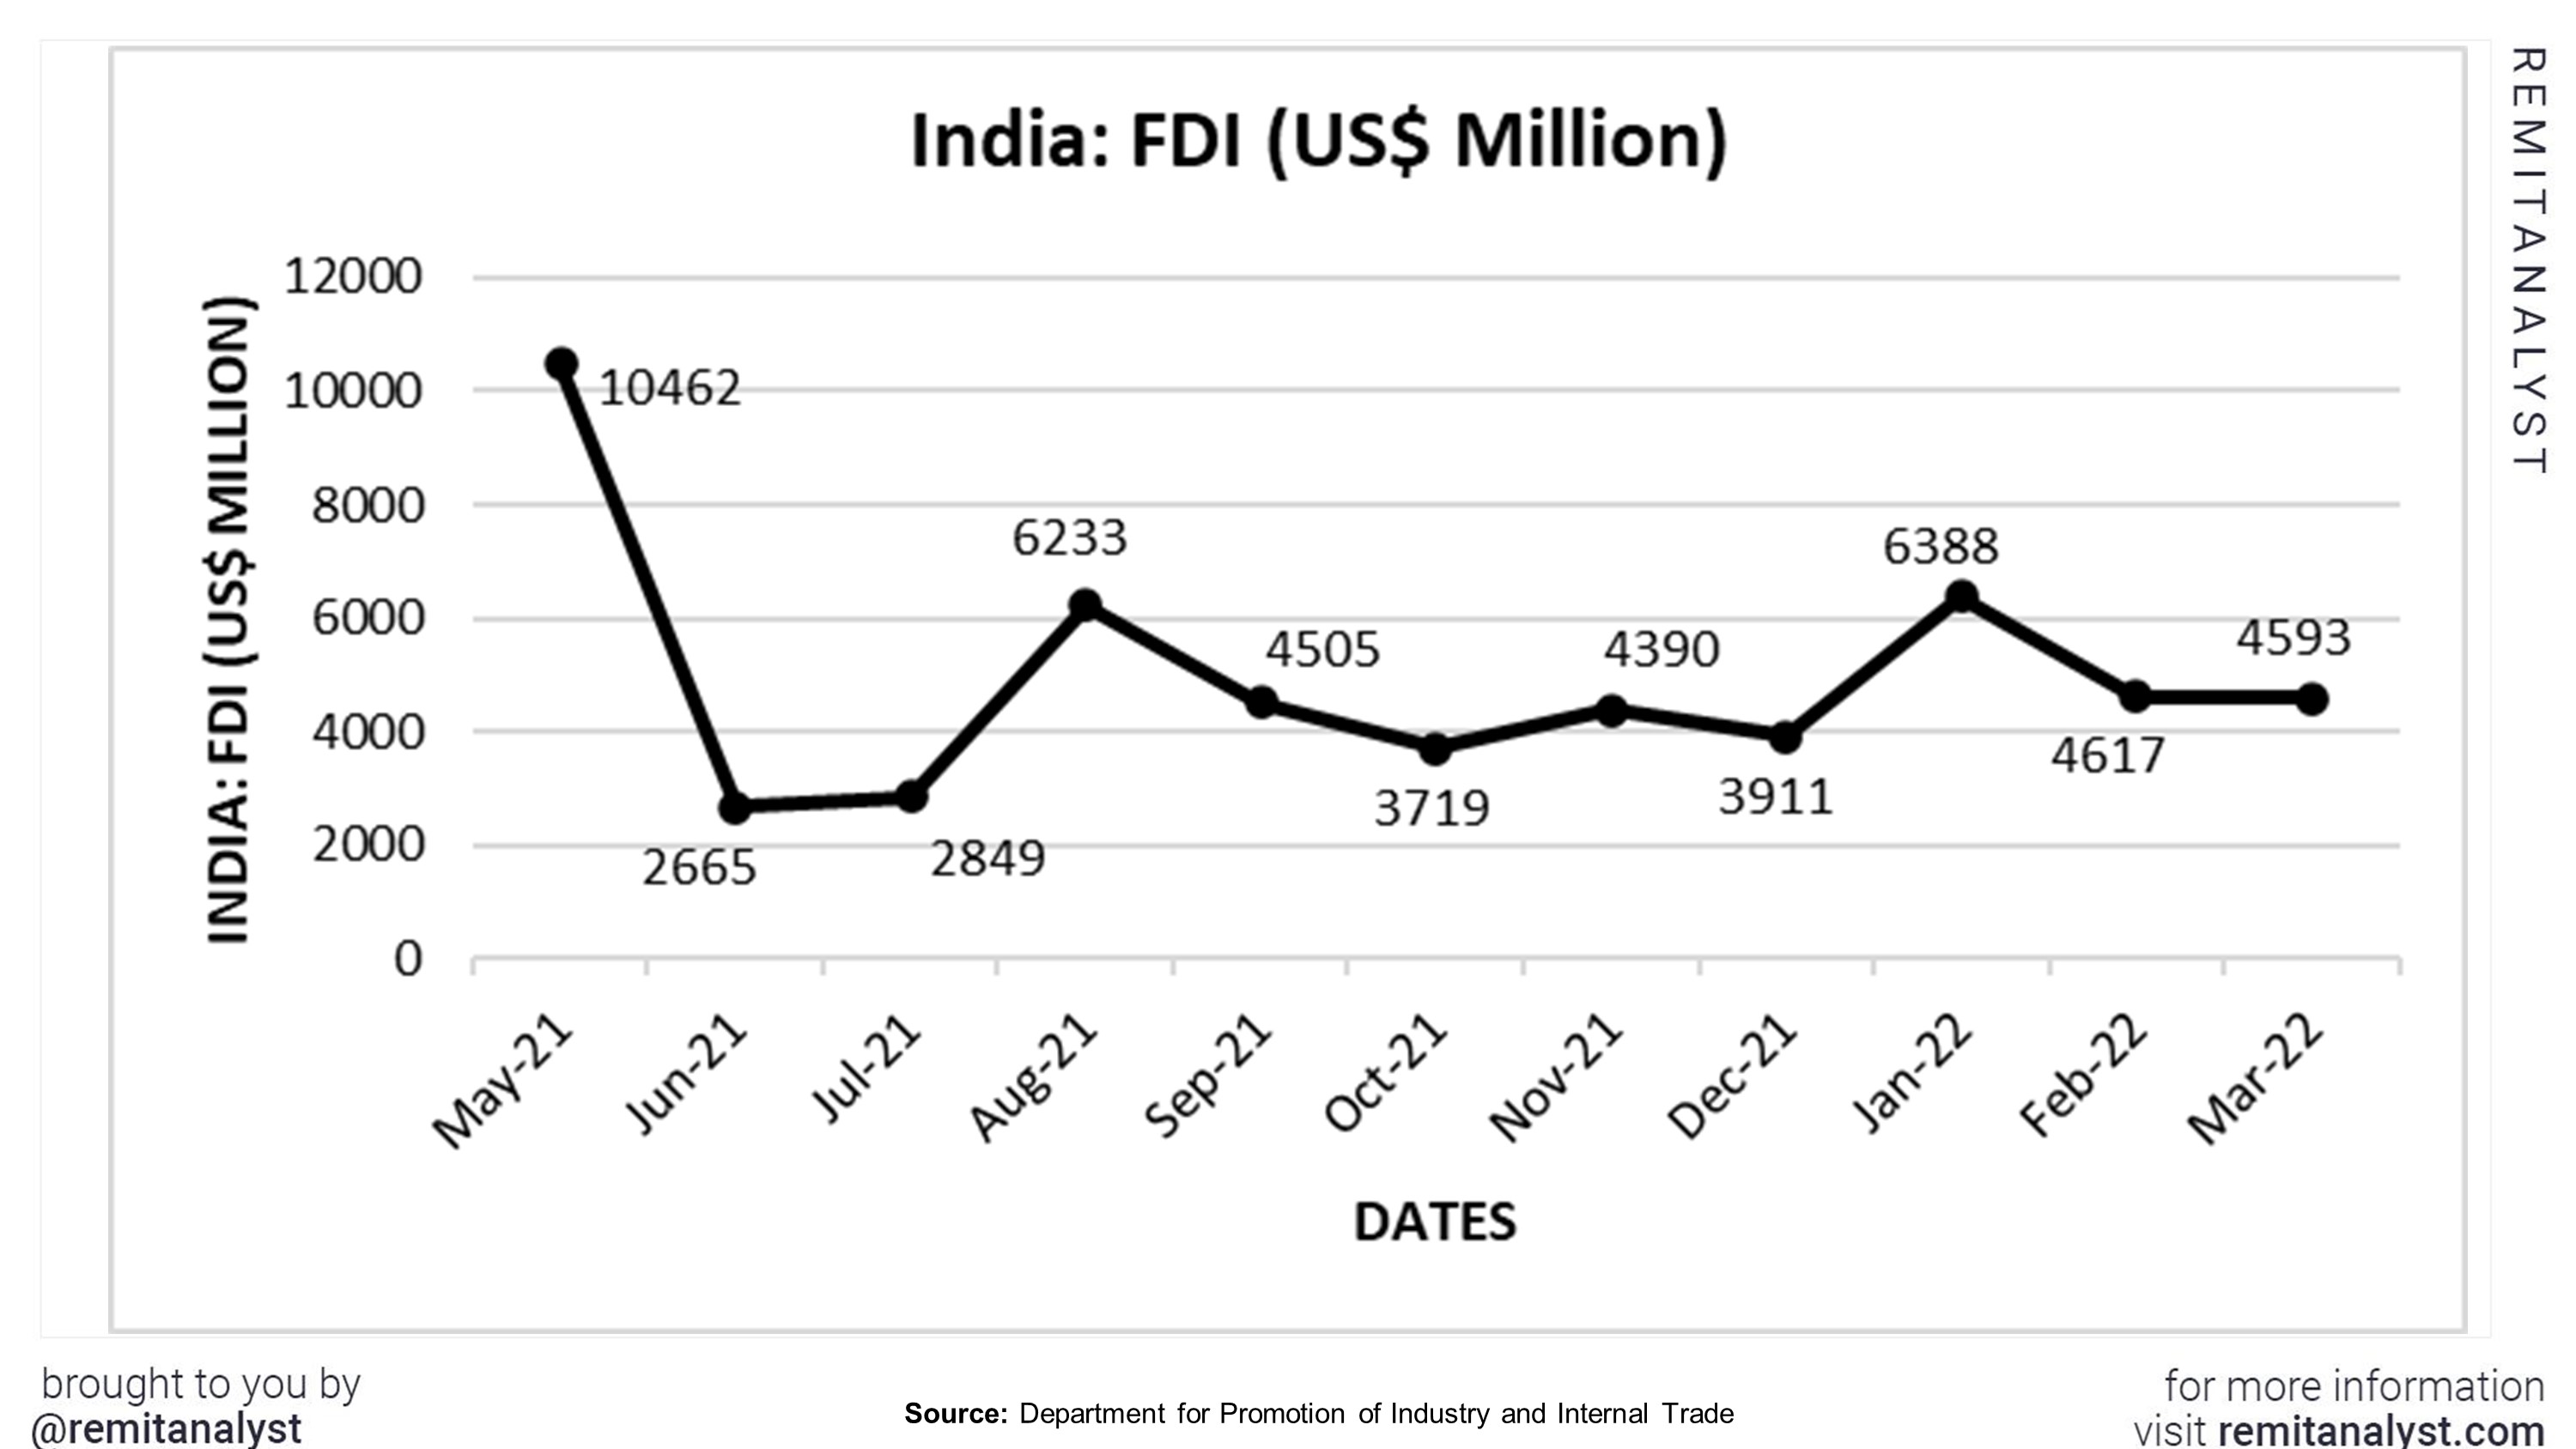
6. Foreign and Domestic Investment
When the interest rates increase, foreign investments increase. This reflects both positively and negatively on the economy. For instance, high cash inflow is a plus. On the contrary, when the RBI purchases more USD, the value of the rupee decreases, which then reflects poorly on the Indian economy. In the financial year 2021-22, around $83B worth of foreign investments were made. The financial year 2022-23 will cross-assets worth more than $100B. This could only suggest that the value of the rupee is expected to depreciate further.
| India's FDI | ||||
|---|---|---|---|---|
| Date | FDI (US$ Million) | |||
| May-21 | 10462 | |||
| Jun-21 | 2665 | |||
| Jul-21 | 2849 | |||
| Aug-21 | 6233 | |||
| Sep-21 | 4505 | |||
| Oct-21 | 3719 | |||
| Nov-21 | 4390 | |||
| Dec-21 | 3911 | |||
| Jan-22 | 6388 | |||
| Feb-22 | 4617 | |||
| Mar-22 | 4593 | |||
When there is a decrease in domestic investments, inflation rises as it suggests that the local currency has lost its purchasing power. The spending decreased from 23304. 25B INR in the fourth quarter of 2022 to 22624. 15B INR in the first quarter of 2022. The graph below suggests that the FDI equity inflow will decrease unless the Indian economy regains stability. The economy is expected to gain some momentum in 2023.
Several interrelated and co-dependent factors affect the performance of the currency. With such intricate elements and details, it is difficult to pinpoint the responsible factor for such a poor performance; the government and the RBI are doing everything in their power to restore the economy and currency. The economy and currency are expected to gain stability and positive momentum by 2023.