Why is the USD to INR Exchange Rate up today on 29th June 2022 (2nd half of June 2022)?

The Indian Rupee has been falling against the US Dollar. While this may be a positive sign for foreign investors, it is worrying to see the Indian economy like this. India faces a trade deficit of $189.5 Billion. A country’s currency is an indicator of the government’s stability, and policies that impact the country’s economy. In order to have a strong currency, the above-mentioned factors must be strong. For instance, the RBI (Reserve bank of India) is responsible for regulating all Indian banks and the rupee. The RBI has come up with a monetary policy that aims at decreasing the inflation rates. It also protects macroeconomic stability.
| USD to INR Exchange Rates | ||||
|---|---|---|---|---|
| Date | Open | High | Low | Close |
| 13-Jun-22 | 78.17 | 78.40 | 77.95 | 78.17 |
| 14-Jun-22 | 78.16 | 78.36 | 77.92 | 78.16 |
| 15-Jun-22 | 77.98 | 78.21 | 77.96 | 77.98 |
| 16-Jun-22 | 77.90 | 78.26 | 77.88 | 77.90 |
| 17-Jun-22 | 77.97 | 78.18 | 77.93 | 77.97 |
| 20-Jun-22 | 77.96 | 78.17 | 77.86 | 77.96 |
| 21-Jun-22 | 77.93 | 78.27 | 77.87 | 77.93 |
| 22-Jun-22 | 78.13 | 78.40 | 78.07 | 78.13 |
| 23-Jun-22 | 78.19 | 78.41 | 78.14 | 78.19 |
| 24-Jun-22 | 78.14 | 78.35 | 78.11 | 78.14 |
| 27-Jun-22 | 78.25 | 78.56 | 78.15 | 78.25 |
| 28-Jun-22 | 78.44 | 79.03 | 78.41 | 78.44 |
| 29-Jun-22 | 79.07 | 79.07 | 78.60 | 79.07 |
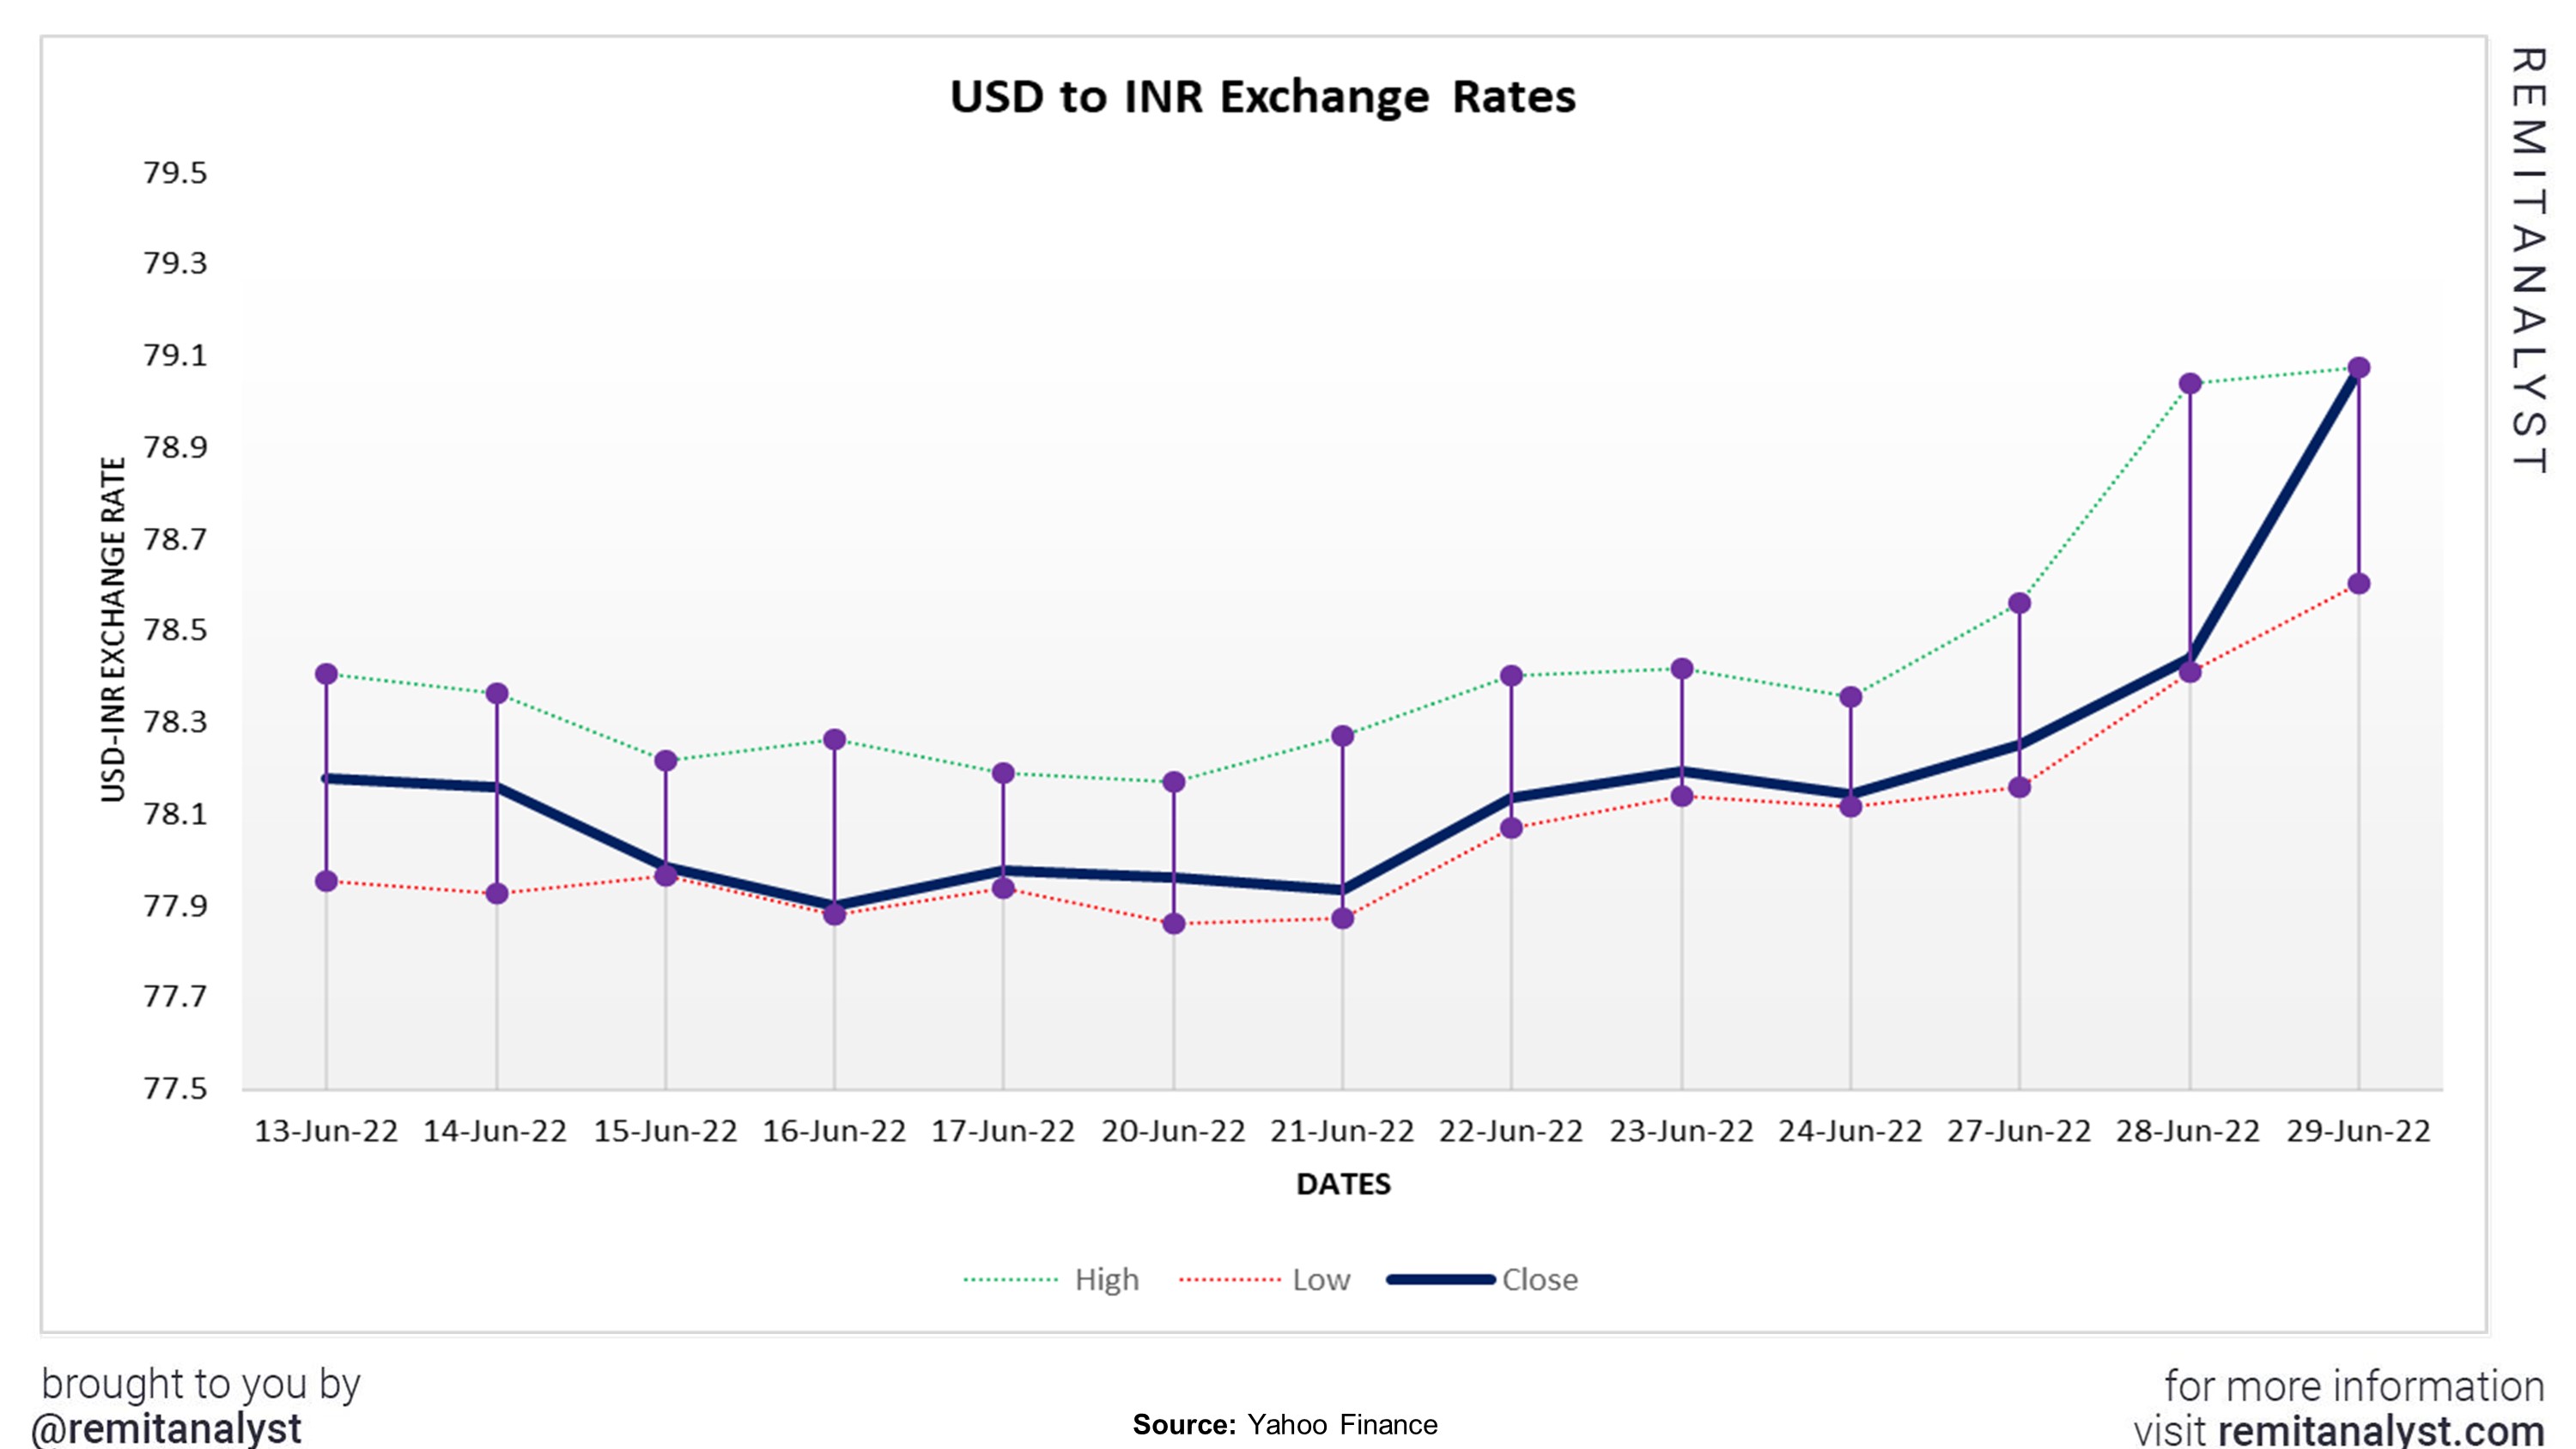
The above graph shows that the Indian rupee has been falling over the past two weeks. It hit a nadir point of 79.06 INR on the 30th of June, 2022, and a zenith of 77.875 INR on the 15th of June, 2022. The currency seemed to improve slightly from the 14th to the 20th of the month June, however, it has declined ever since. $1 was equivalent to an average of 78.2 rupees, and the value differed positively or negatively by an average of 0.15 rupee every day in the past two weeks (14th of June, 2022 to 30th of June, 2022).
On close observation, we can find that there are many factors that affect the currency. There are six major factors, they are:
1. Crude oil
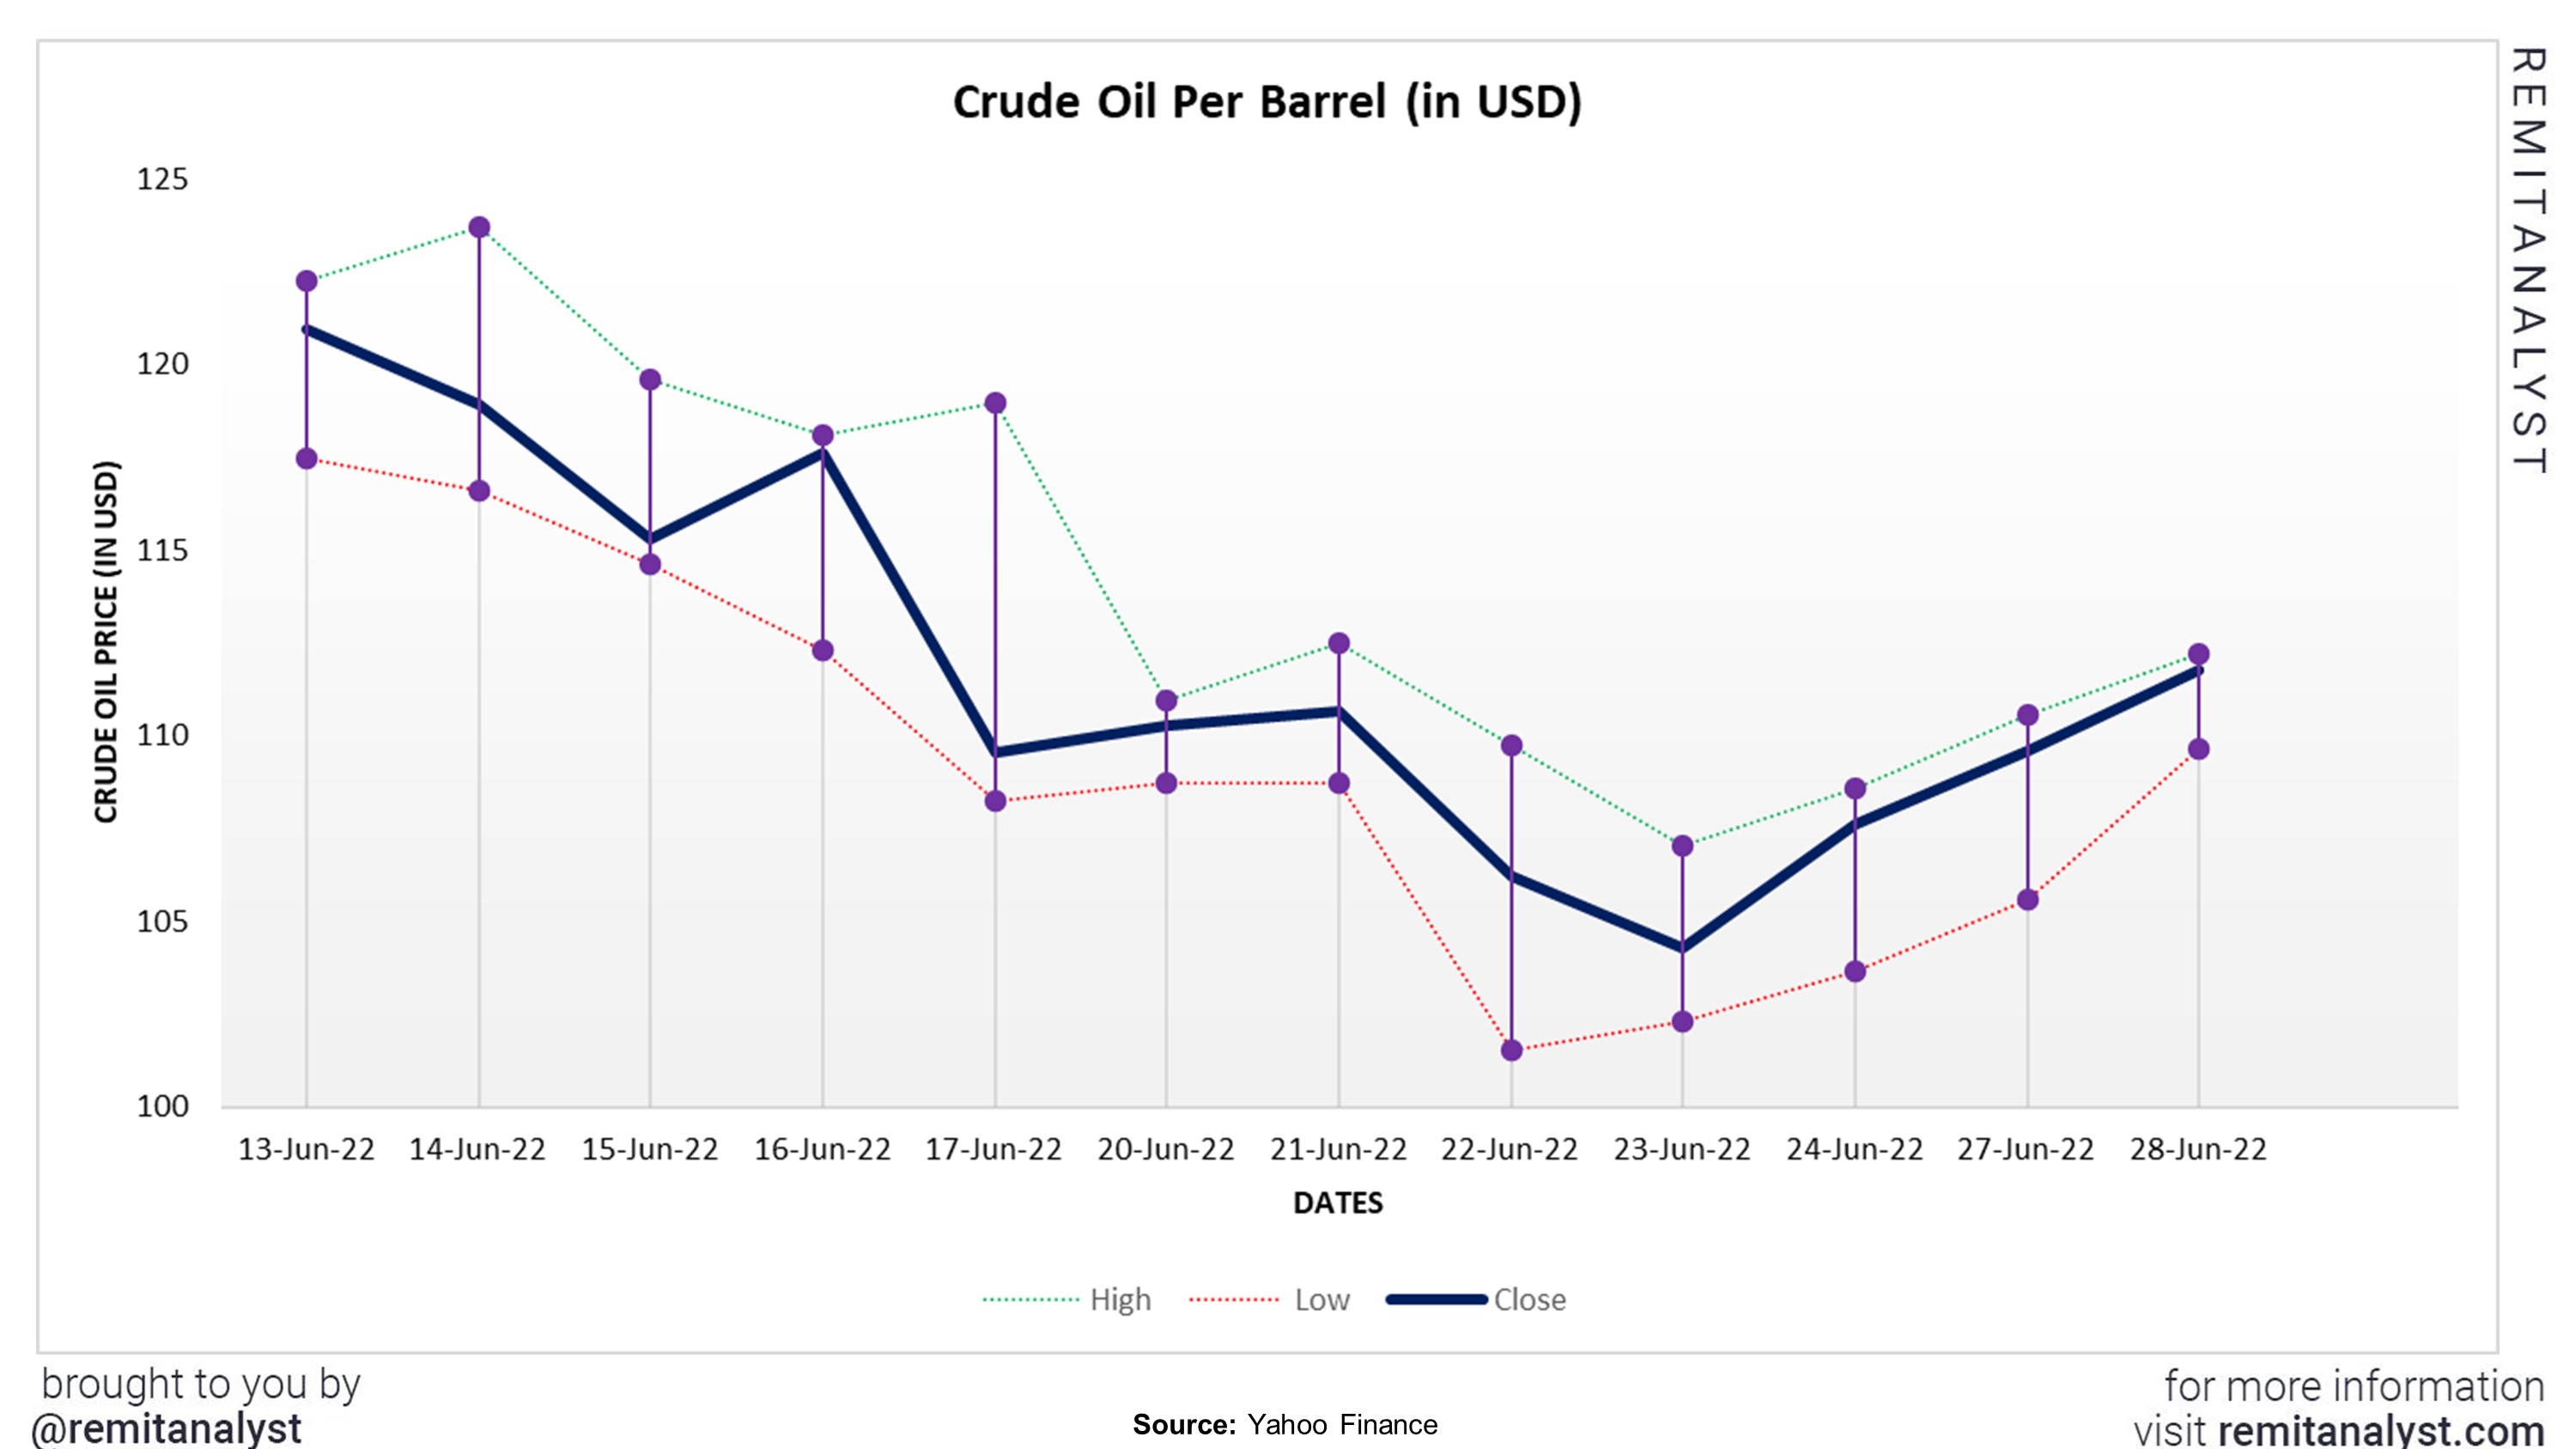
India imports over 85% of crude oil from other countries. Due to the ongoing Ukraine- Russia conflict, the price of crude oil is almost $120 per barrel. By the end of May 2022, India spent around $18.14B on crude oil, as opposed to $9.47B in May 2021. The cost has almost doubled in just a span of 12 months. The price reached an all-time high of $119.61 per barrel on the 15th of June, 2022, and a low of $101.53 per barrel on the 22nd of June, 2022.
The trend analysis suggests that the prices have been gradually declining, which is a good sign for the Indian and the global economy. However, the last two days have shown an increase in the price. This could be a cause of worry. An increase in the cost of crude oil can increase the cost of production and manufacturing, which in turn could raise the inflation level. Thereby, decreasing the value of the Indian currency.
| Crude Oil (in USD) | ||||
|---|---|---|---|---|
| Date | Open | High | Low | Close |
| 28-Jun-22 | 110.18 | 112.22 | 109.62 | 111.76 |
| 27-Jun-22 | 107.22 | 110.54 | 105.6 | 109.57 |
| 24-Jun-22 | 103.99 | 108.58 | 103.64 | 107.62 |
| 23-Jun-22 | 104.42 | 107.05 | 102.32 | 104.27 |
| 22-Jun-22 | 109.54 | 109.76 | 101.53 | 106.19 |
| 21-Jun-22 | 110.58 | 112.47 | 108.72 | 110.65 |
| 20-Jun-22 | 110.58 | 110.95 | 108.72 | 110.27 |
| 17-Jun-22 | 117.08 | 118.97 | 108.25 | 109.56 |
| 16-Jun-22 | 115.98 | 118.08 | 112.31 | 117.59 |
| 15-Jun-22 | 119.07 | 119.61 | 114.6 | 115.31 |
| 14-Jun-22 | 121.09 | 123.68 | 116.62 | 118.93 |
| 13-Jun-22 | 120.19 | 122.25 | 117.47 | 120.93 |
2. Gold imports
Indians are known to make gold investments. As of 31st May 2022, India’s gold imports were around 7.72% of the total imports as opposed to 2.78% on 30th April 2022. The purchase of gold affects the supply and demand of the local currency, which may lead to inflation. On average, gold costed around $1836 per ounce. On June 17th, 2022, the price reached a high of $1,853.70 per ounce. Where people enjoyed a low of $1,802.50 per ounce on the 30th of June, 2022.
| Gold Rate (in USD) | ||||
|---|---|---|---|---|
| Date | Open | High | Low | Close |
| 15-Jun-22 | 1814.1 | 1839 | 1810.8 | 1815.3 |
| 16-Jun-22 | 1819.2 | 1850.6 | 1814.9 | 1845.7 |
| 17-Jun-22 | 1853.7 | 1853.7 | 1833.6 | 1835.6 |
| 21-Jun-22 | 1835.3 | 1838.6 | 1830.1 | 1834.6 |
| 22-Jun-22 | 1829.5 | 1842.7 | 1821.6 | 1834.3 |
| 23-Jun-22 | 1835.5 | 1841.2 | 1825.7 | 1825.7 |
| 24-Jun-22 | 1820.5 | 1826.5 | 1815.8 | 1826.5 |
| 27-Jun-22 | 1830.5 | 1830.7 | 1819.9 | 1820.9 |
| 28-Jun-22 | 1824.2 | 1826 | 1817.5 | 1817.5 |
| 29-Jun-22 | 1818.3 | 1830.3 | 1812.8 | 1813.7 |
| 30-Jun-22 | 1819.2 | 1826.8 | 1802.5 | 1819.1 |
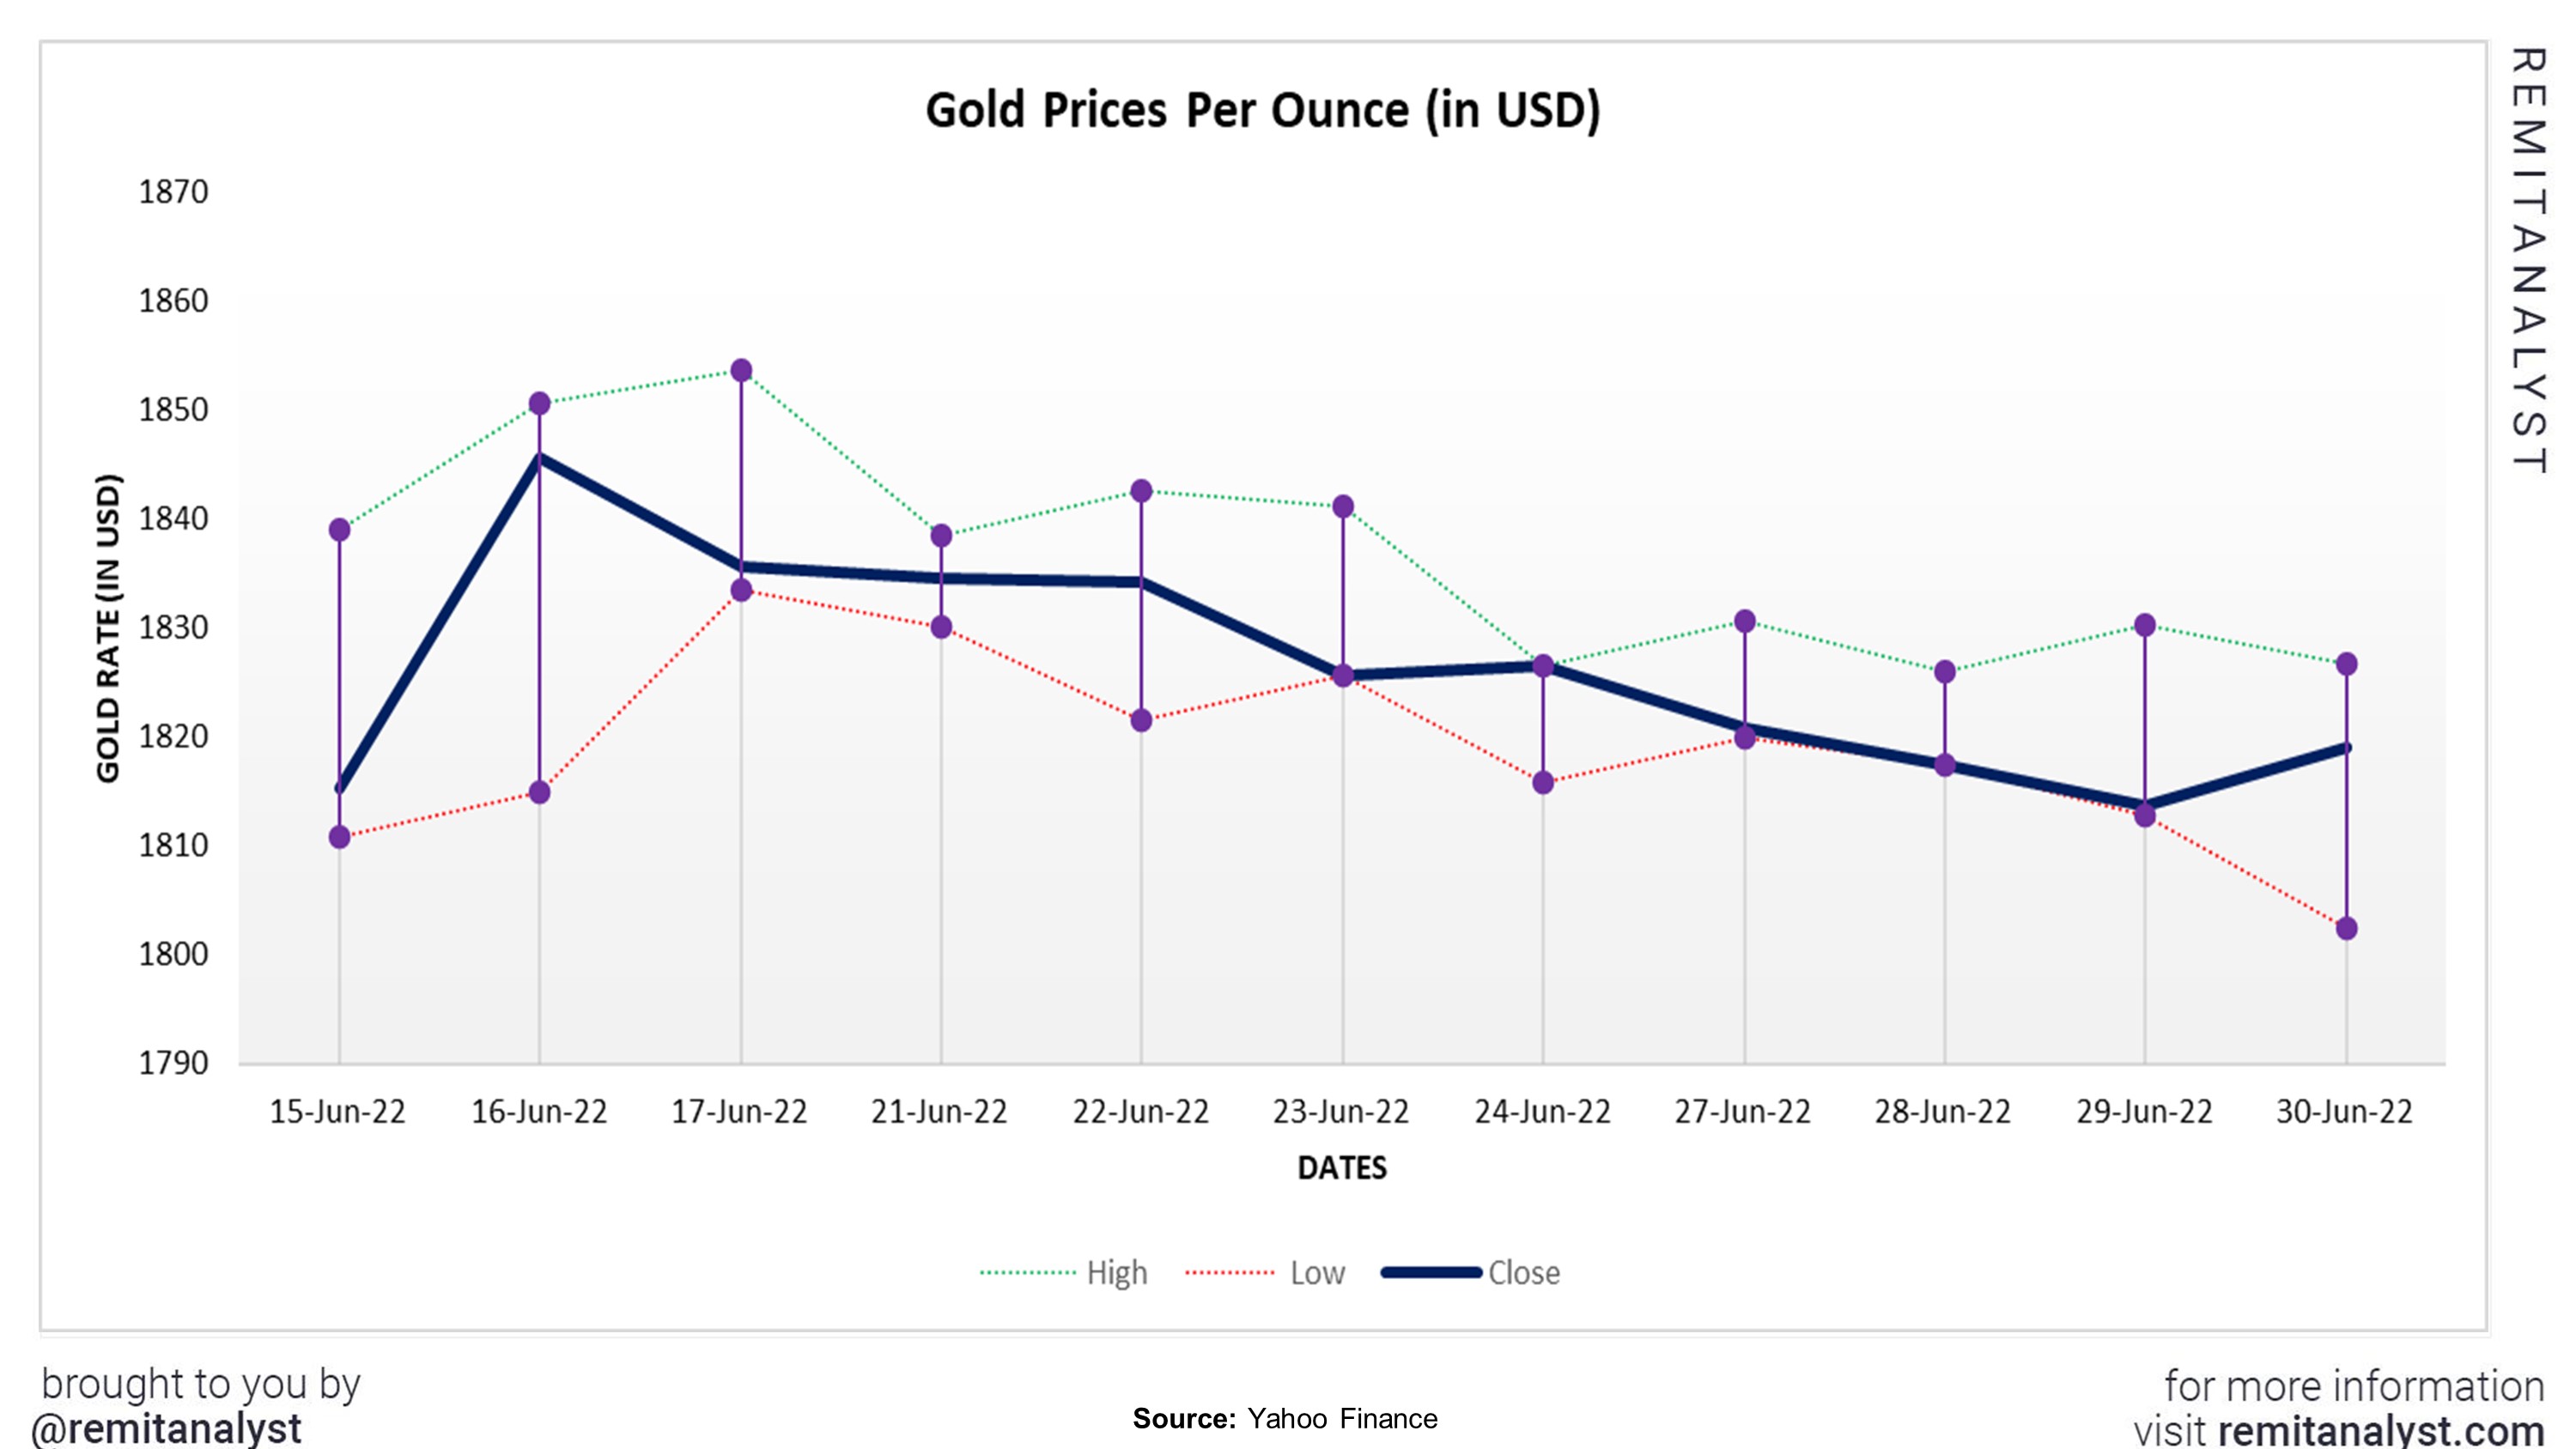
Since the government has purchased a surplus amount of gold compared to the previous years, there is a chance that the inflation caused by such a purchase can lead to the decline of the Indian currency. To try and curb the gold imports, the Indian government has raised the import duty on gold from 10.75% to 15 %. This came into effect on the 30th of June, 2022.
3. GDP & Import/Export
Gross Domestic Product or GDP is dependent on exports, personal consumption expenditure, business investment and government spending. GDP rises when the exports exceed the imports. Which in turn increases the value of the country’s currency.
| India's Imports/Exports | ||||
|---|---|---|---|---|
| Date | Export | Export (US$ Million) | Import | Import (US$ Million) |
| May-22 | 23606 | 23.606 | 10836 | 10.836 |
| Apr-22 | 22594 | 22.594 | 11389 | 11.389 |
| Mar-22 | 26948 | 26.948 | 11866 | 11.866 |
| Feb-22 | 21302 | 21.302 | 12581 | 12.581 |
| Jan-22 | 21625 | 21.625 | 11605 | 11.605 |
| Dec-21 | 25306 | 25.306 | 12585 | 12.585 |
| Nov-21 | 20136 | 20.136 | 14891 | 14.891 |
| Oct-21 | 19845 | 19.845 | 13237 | 13.237 |
| Sep-21 | 21609 | 21.609 | 12971 | 12.971 |
| Aug-21 | 20455 | 20.455 | 15348 | 15.348 |
| Jul-21 | 19357 | 19.357 | 14052 | 14.052 |
| Jun-21 | 20299 | 20.299 | 15195 | 15.195 |
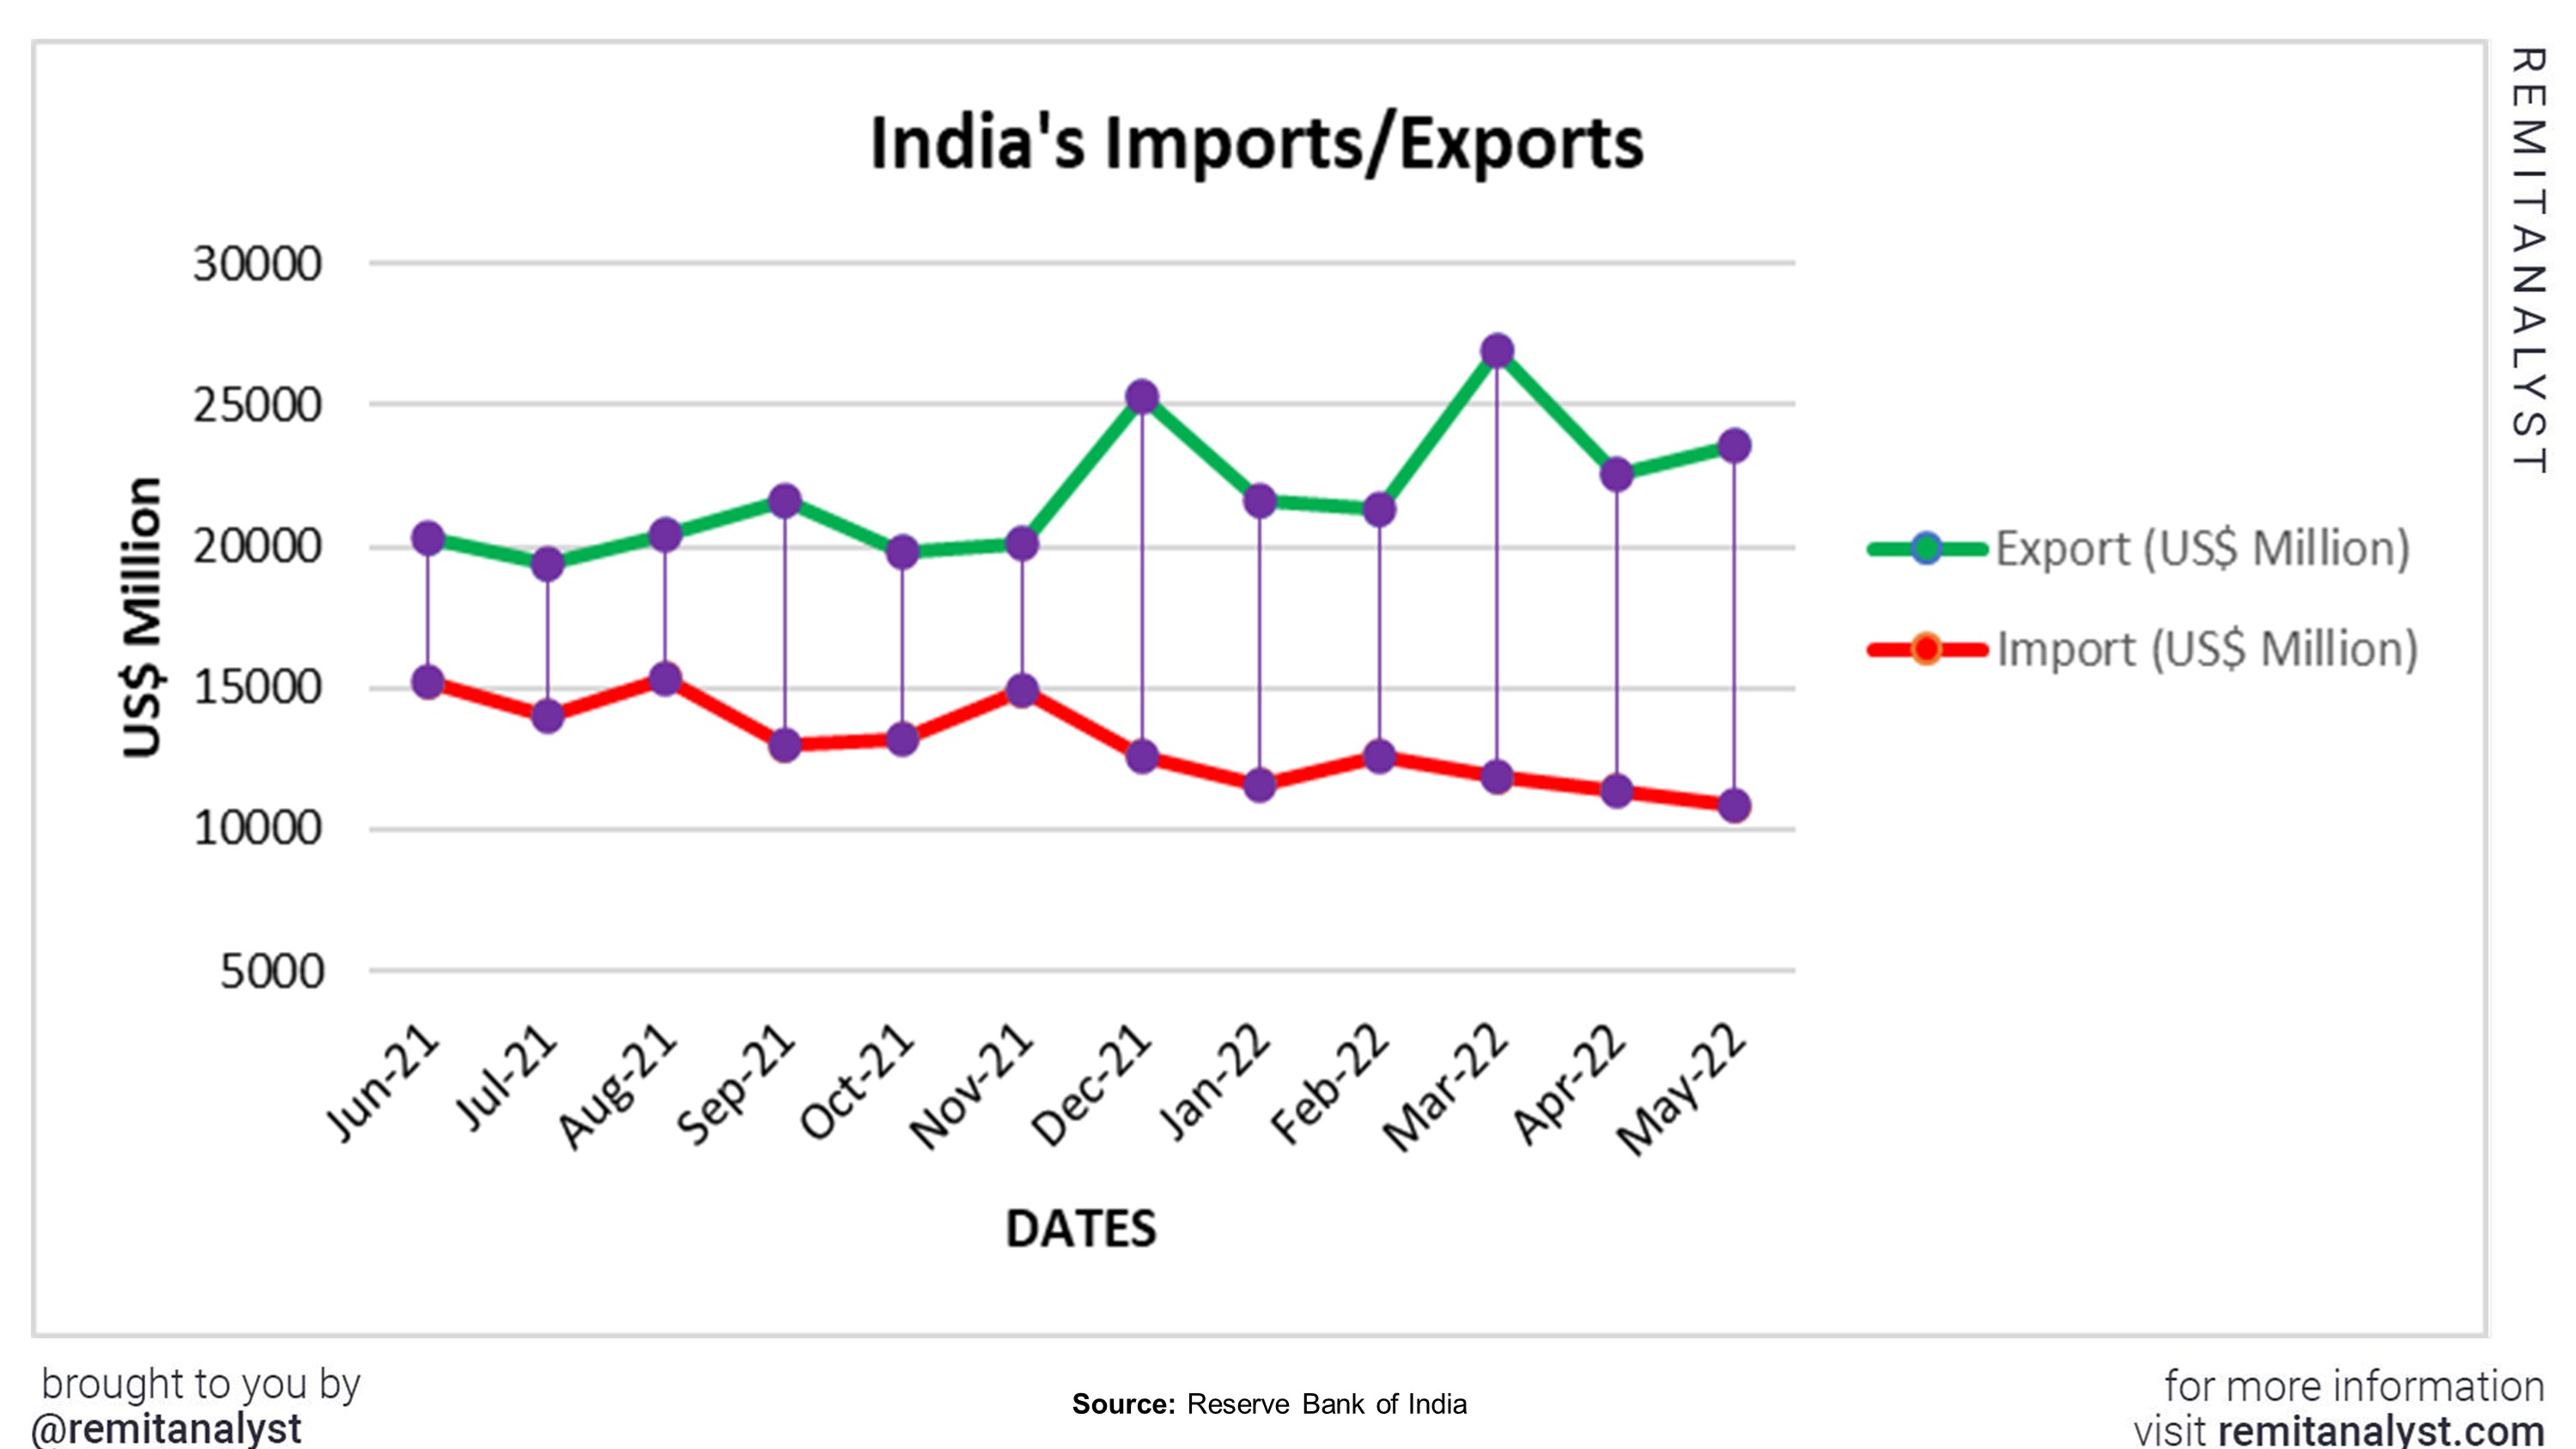
The exports increased from February 2022 to March 2022, but have declined ever since. As of May 2022, India has imported goods worth 63.22 billion USD. However, the exports were only worth 38.94 billion USD. This leads to a deficit of $25.63B in the import-export exchange which leads to a decline in GDP. This also explains why the rupee has been falling.
4. Inflation Rates
Inflation can be equated to a decrease in a currency’s buying power. Thus, a rise in inflation can devalue a currency.
| India's Inflation rates | |
|---|---|
| Date | Percentage |
| Jun-21 | 6.26 |
| Jul-21 | 5.59 |
| Aug-21 | 5.3 |
| Sep-21 | 4.35 |
| Oct-21 | 4.48 |
| Nov-21 | 4.91 |
| Dec-21 | 5.66 |
| Jan-22 | 6.01 |
| Feb-22 | 6.07 |
| Mar-22 | 6.95 |
| Apr-22 | 7.79 |
| May-22 | 7.04 |
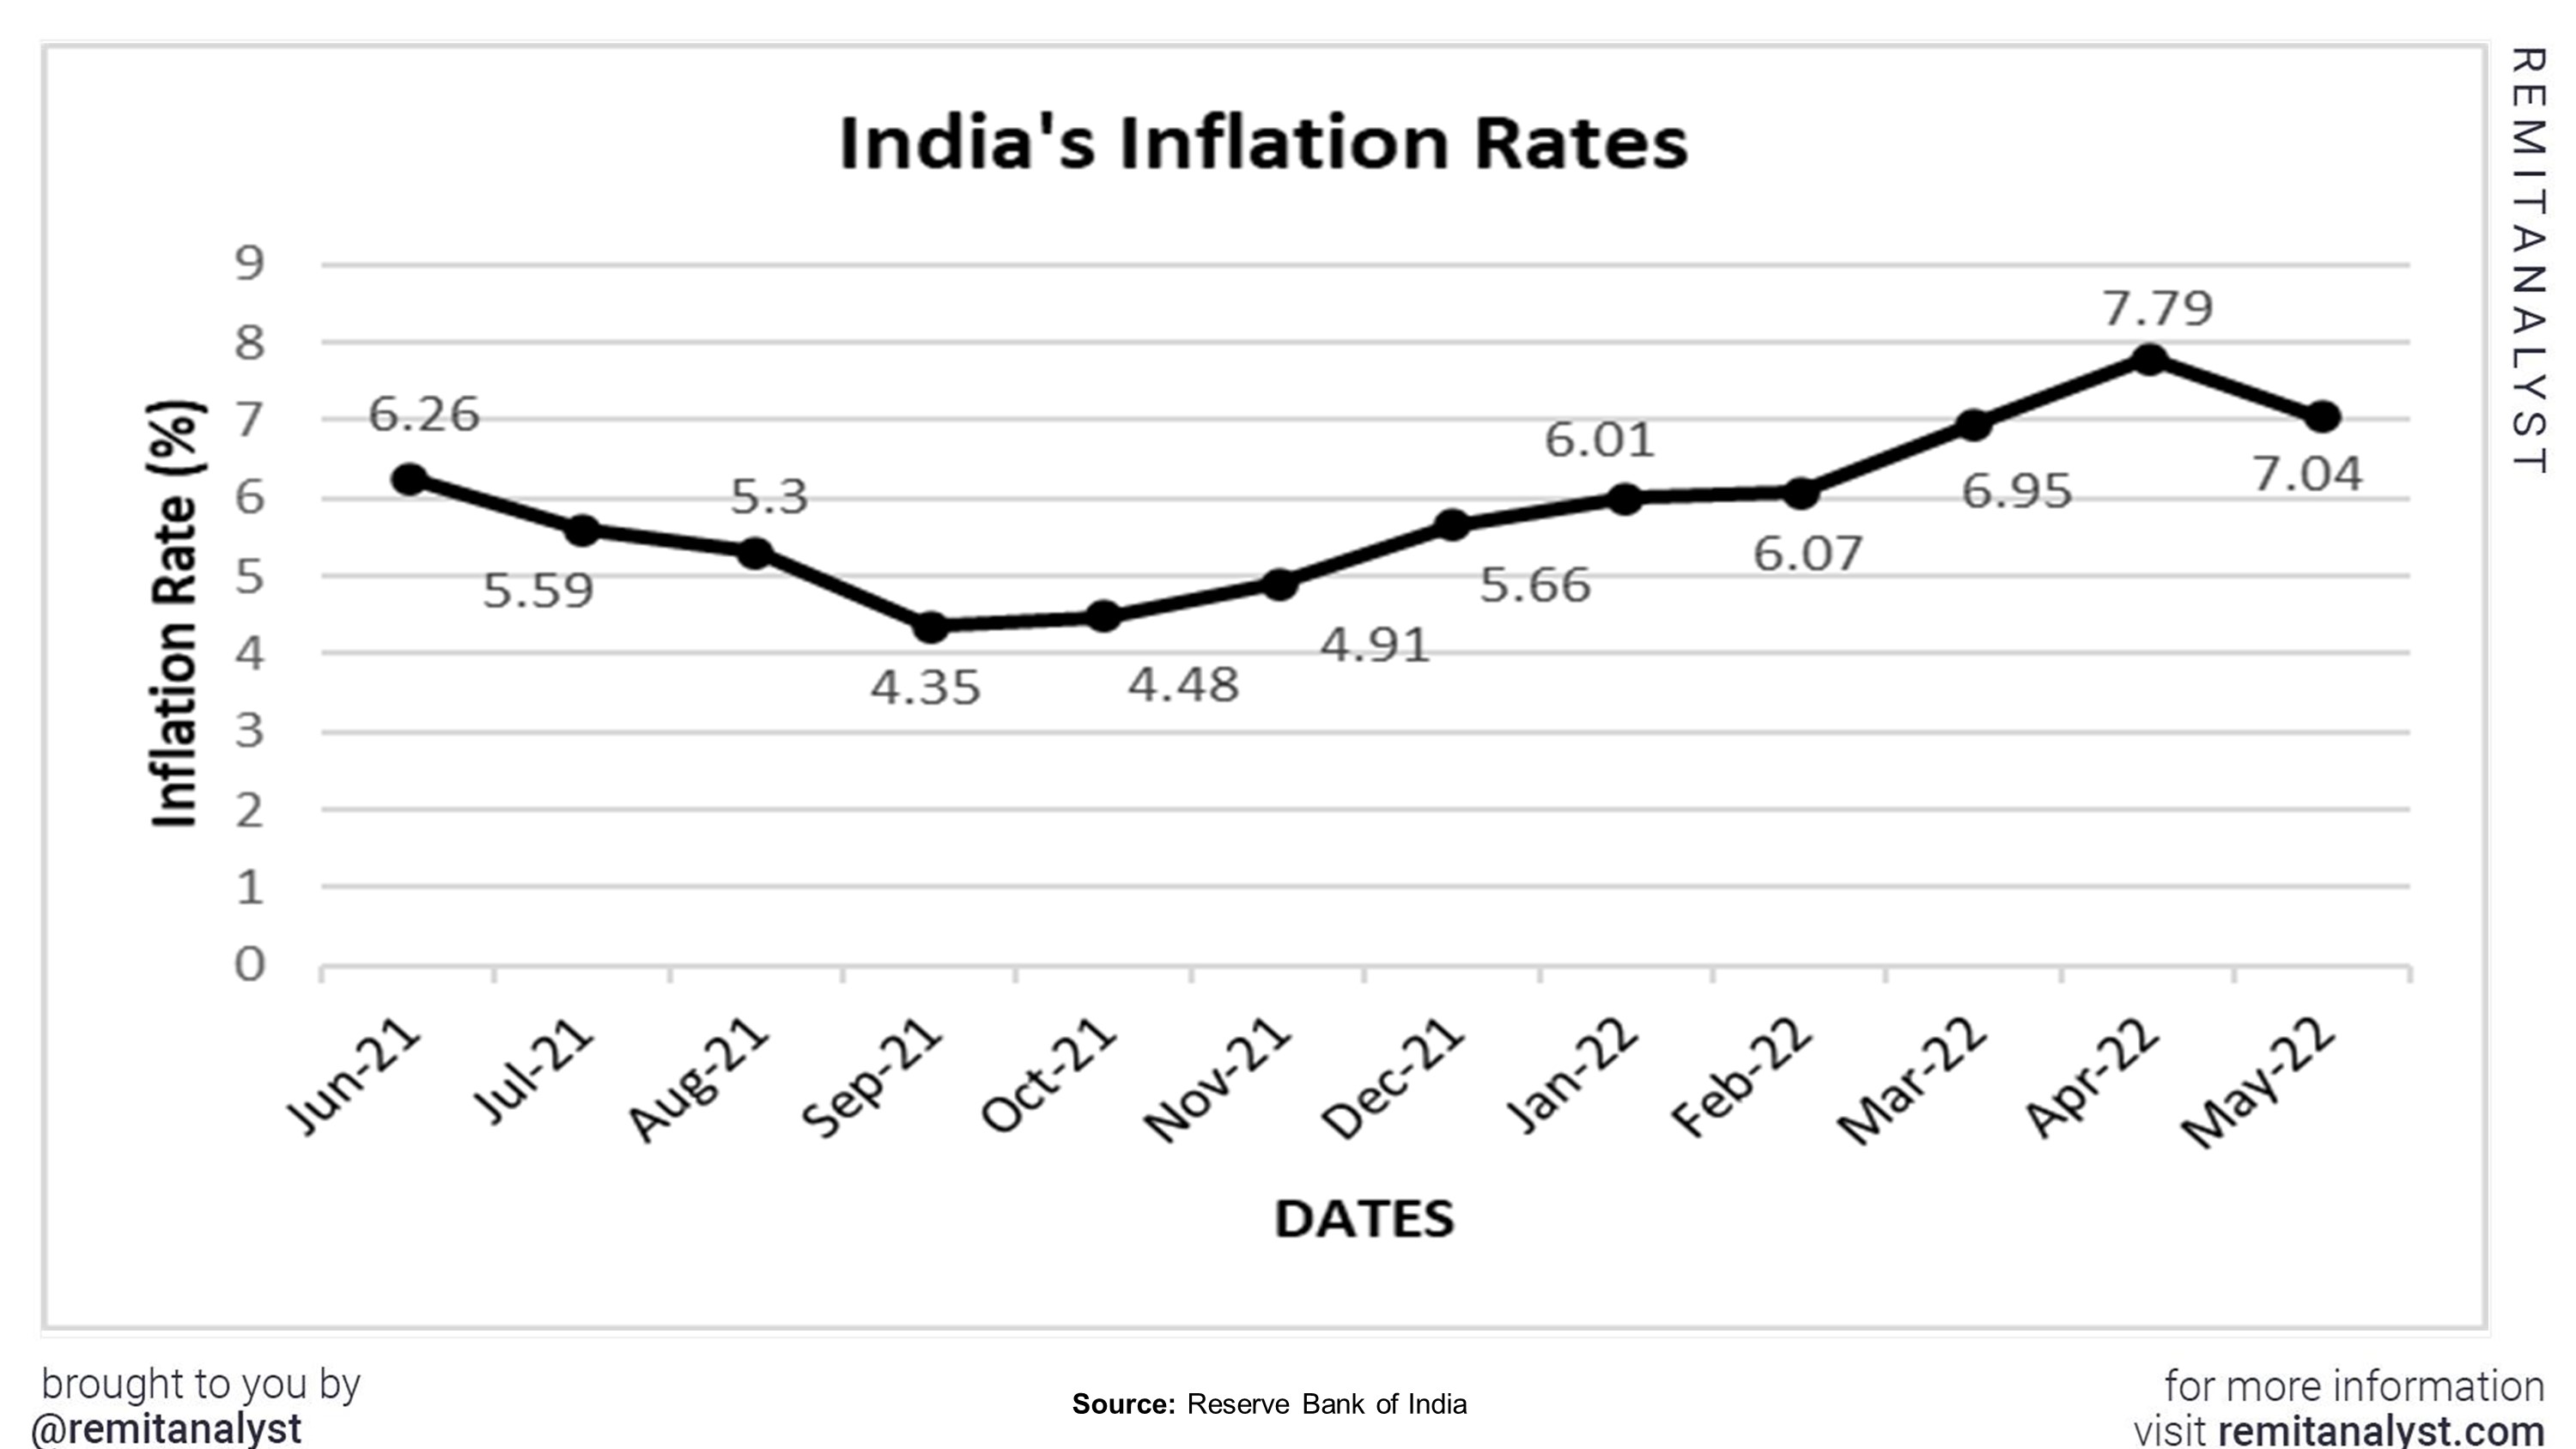
From the above graph, we can observe that the inflation rates have increased significantly from 4.35% in September 2021 to 7.79% in April 2022. However, in May 2022, there was a slight dip in the inflation rate to 7.04 %. This may seem like a positive sign. But economists have predicted the inflation rates to breach 8% by the end of June 2022. This may affect the rupee significantly.
| US Inflation rates | |
|---|---|
| Date | Percentage |
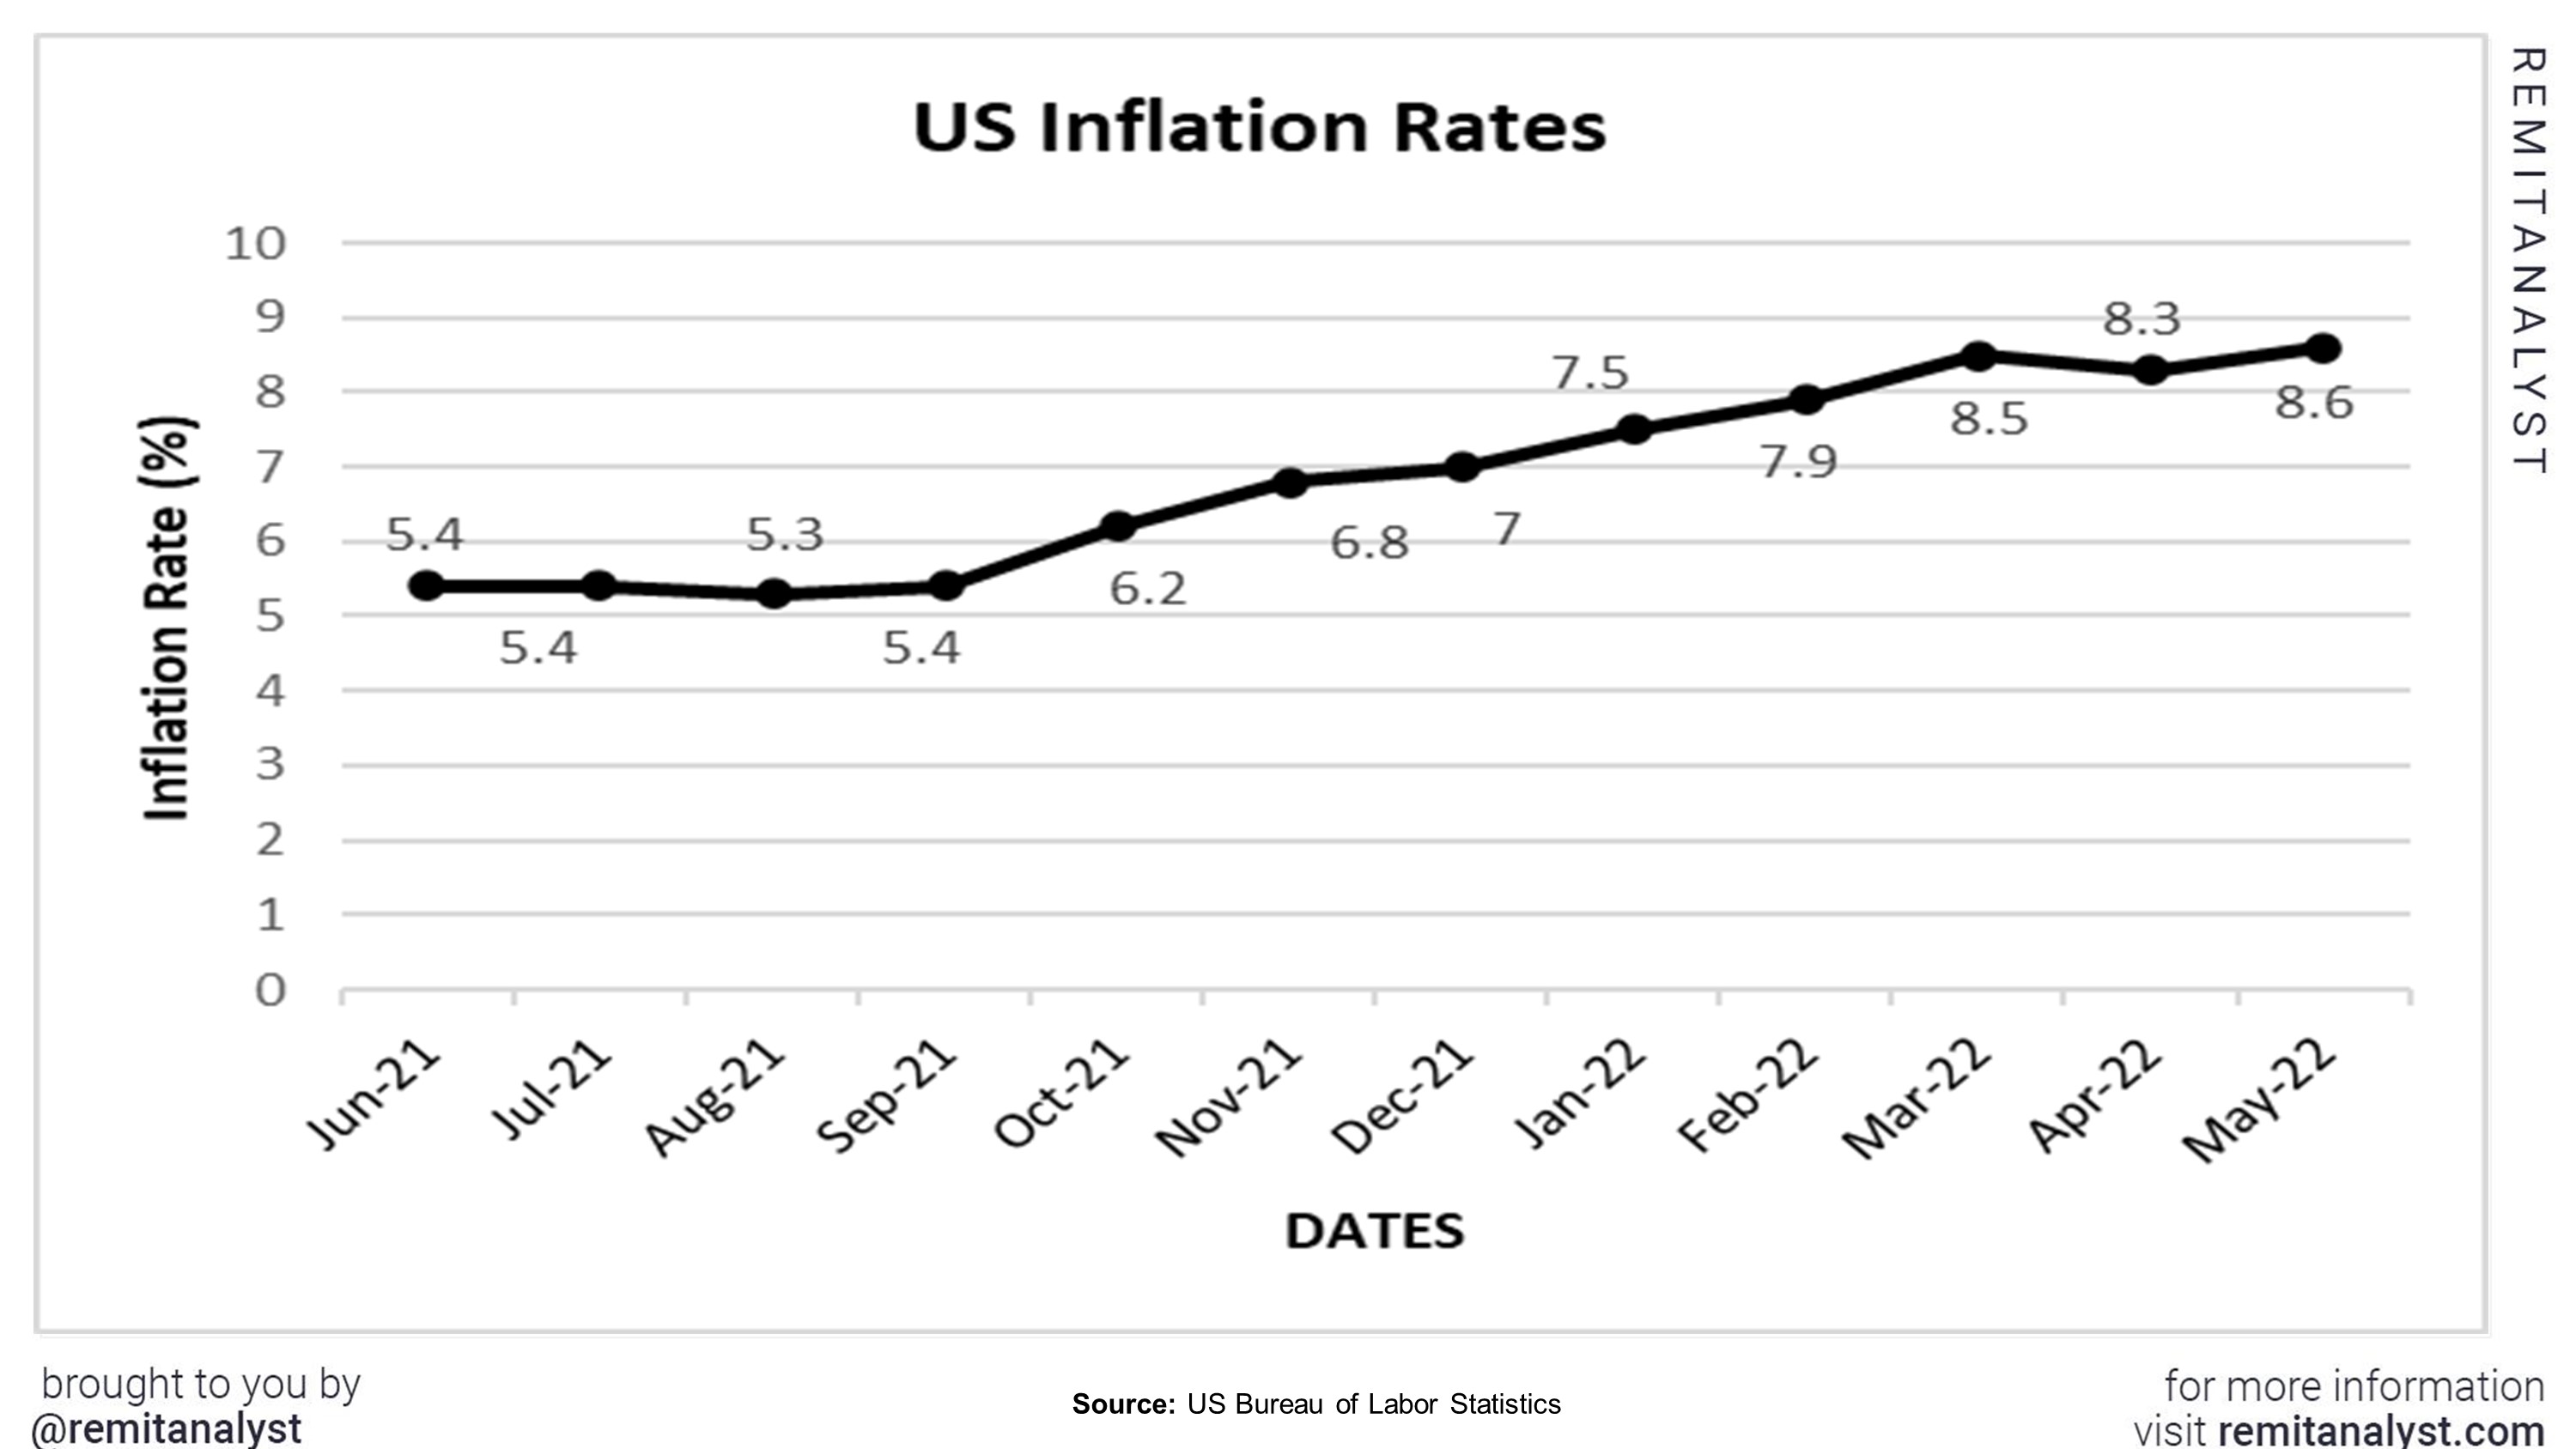
| Jun-21 | 5.4 |
| Jul-21 | 5.4 |
| Aug-21 | 5.3 |
| Sep-21 | 5.4 |
| Oct-21 | 6.2 |
| Nov-21 | 6.8 |
| Dec-21 | 7 |
| Jan-22 | 7.5 |
| Feb-22 | 7.9 |
| Mar-22 | 8.5 |
| Apr-22 | 8.3 |
| May-22 | 8.6 |
| Jun-22 | 9.1 |
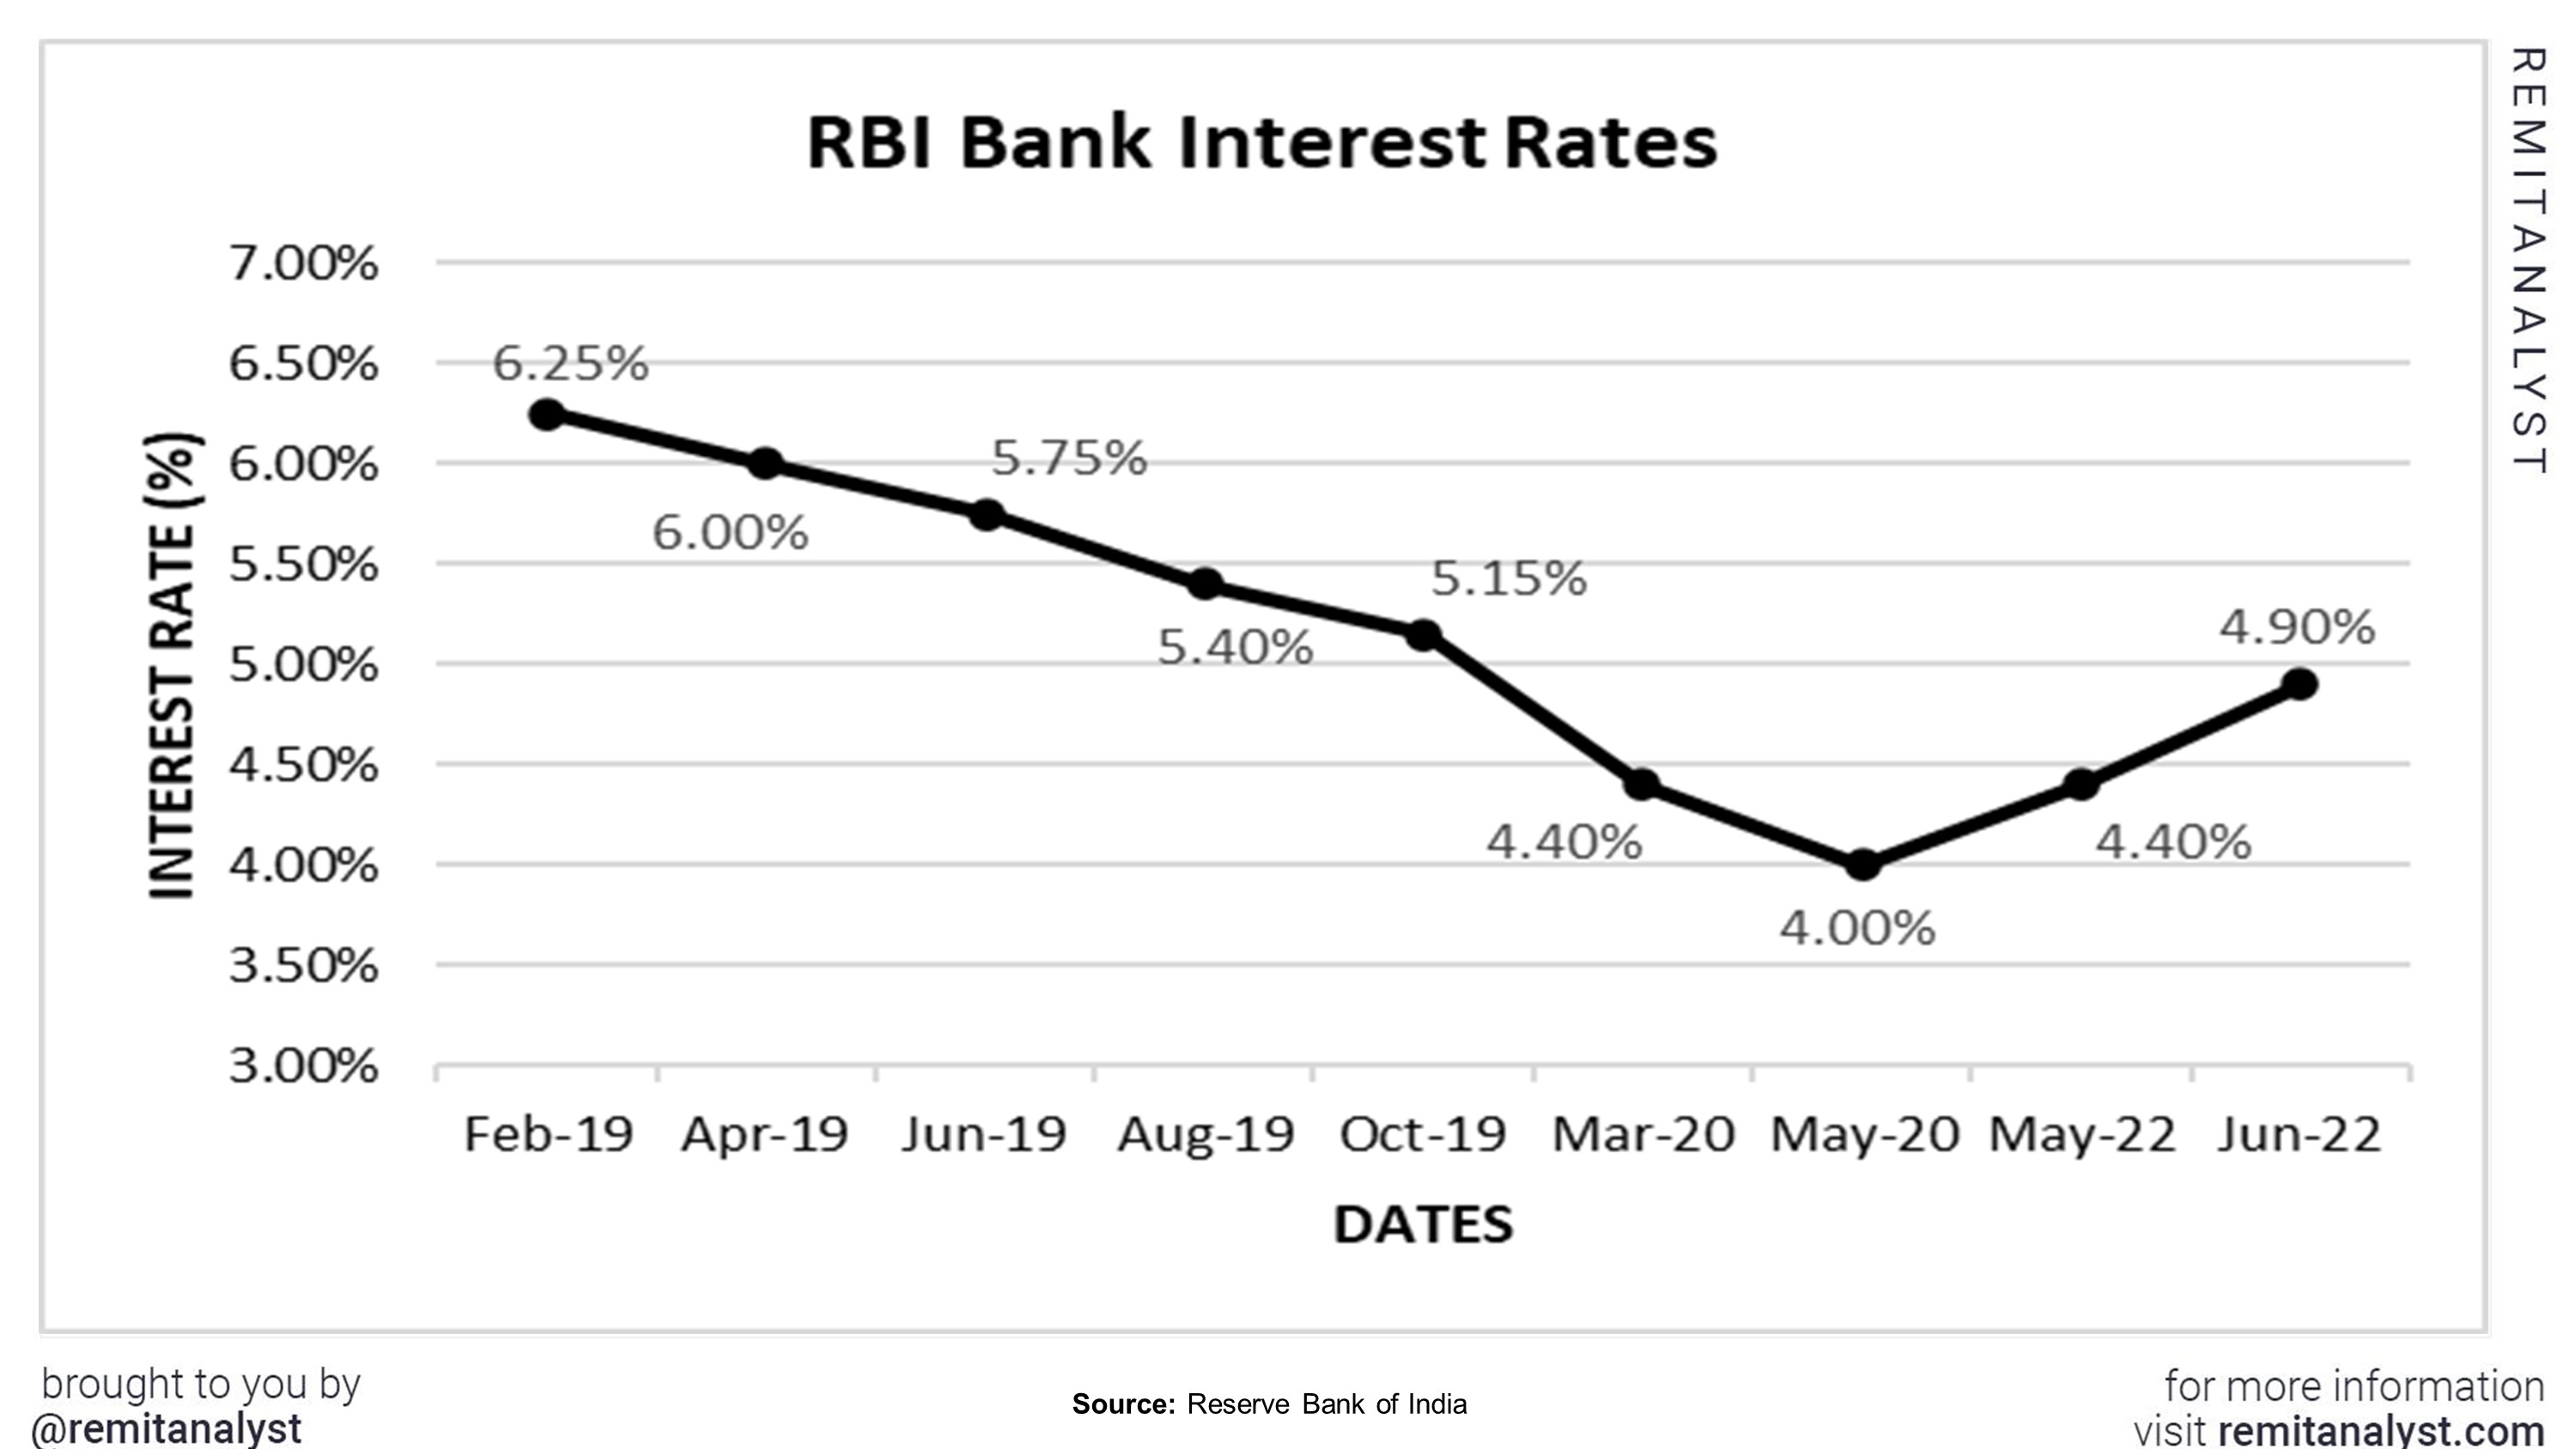
5. Interest Rates
Generally higher interest rates increase foreign investments which suggests that the economy might be growing. A stable and growing economy always strengthens the local currency. Due to the coronavirus pandemic, the years 2020 and 2021 had interest rates close to 4%. However, the rates started increasing in 2022. The RBI is expected to increase the interest rates to 5.9% by the end of this year. This could reflect positively on the Indian rupee.
| RBI Bank Interest Rates | ||||
|---|---|---|---|---|
| Date | Rate (%) | |||
| Feb-19 | 6.25% | |||
| Apr-19 | 6.00% | |||
| Jun-19 | 5.75% | |||
| Aug-19 | 5.40% | |||
| Oct-19 | 5.15% | |||
| Mar-20 | 4.40% | |||
| May-20 | 4.00% | |||
| May-22 | 4.40% | |||
| Jun-22 | 4.90% | |||
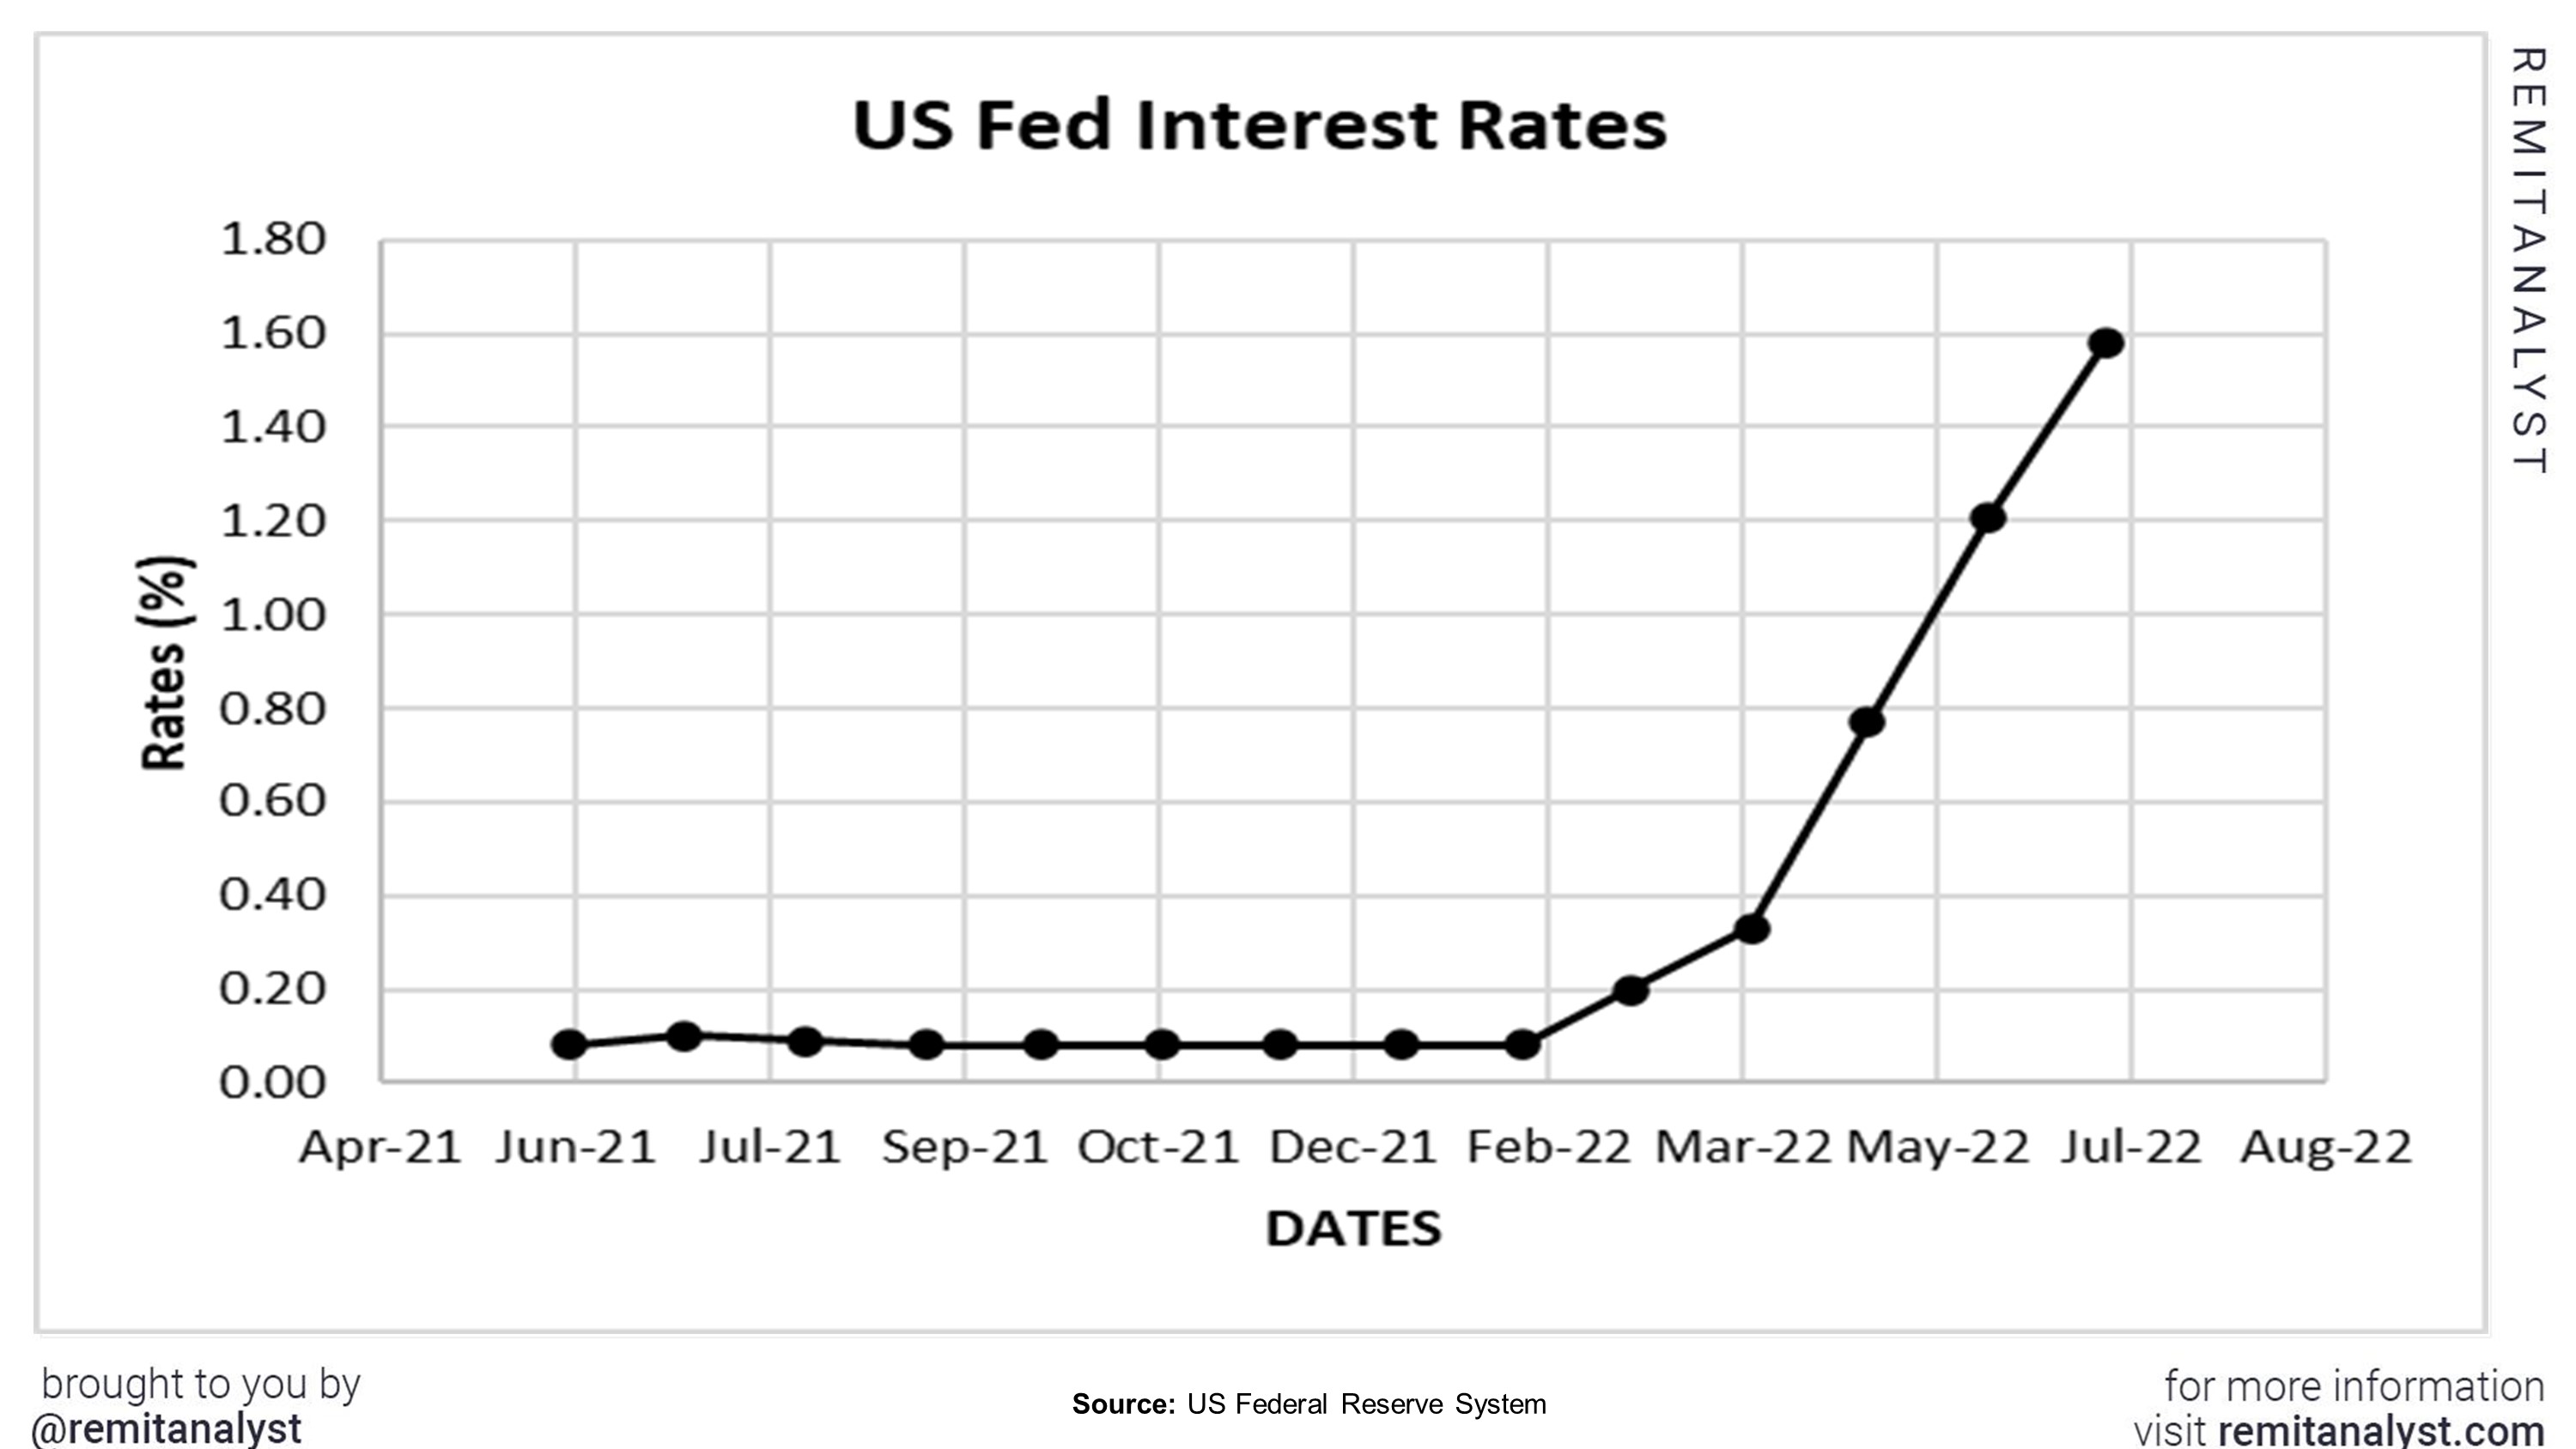
Another noteworthy point is that the US Federal Reserve has increased the interest rate by 75 basis points. Increased interest rates coupled with accelerated foreign investments and rising crude oil prices, all led to the decline in the value of the rupee. Rising interest rates may also lead to an increase in borrowing costs, which may pose a hindrance to overseas fundraising. For instance, the interest rates for borrowing in public banks increased from 8.2% in April 2022 to 8.23% in May 2022. Whereas in private banks, the interest rates increased from 9.62% in April 2022 to 9.76% in May 2022.
| US Fed Interest Rates | ||||
|---|---|---|---|---|
| Date | Interest Rate | |||
| Jun-21 | 0.08 | |||
| Jul-21 | 0.10 | |||
| Aug-21 | 0.09 | |||
| Sep-21 | 0.08 | |||
| Oct-21 | 0.08 | |||
| Nov-21 | 0.08 | |||
| Dec-21 | 0.08 | |||
| Jan-22 | 0.08 | |||
| Feb-22 | 0.08 | |||
| Mar-22 | 0.20 | |||
| Apr-22 | 0.33 | |||
| May-22 | 0.77 | |||
| Jun-22 | 1.21 | |||
| Jul-22 | 1.58 | |||
6. Foreign and Domestic Investment
There are two types of investments- Foreign and Domestic. As the name suggests, foreign investments are made by residents of other countries and domestic investments refer to those made by the residents of India. Both these have a significant effect on the value of the rupee.
| India's FDI | ||||
|---|---|---|---|---|
| Date | FDI (US$ Million) | |||
| May-21 | 10462 | |||
| Jun-21 | 2665 | |||
| Jul-21 | 2849 | |||
| Aug-21 | 6233 | |||
| Sep-21 | 4505 | |||
| Oct-21 | 3719 | |||
| Nov-21 | 4390 | |||
| Dec-21 | 3911 | |||
| Jan-22 | 6388 | |||
| Feb-22 | 4617 | |||
| Mar-22 | 4593 | |||
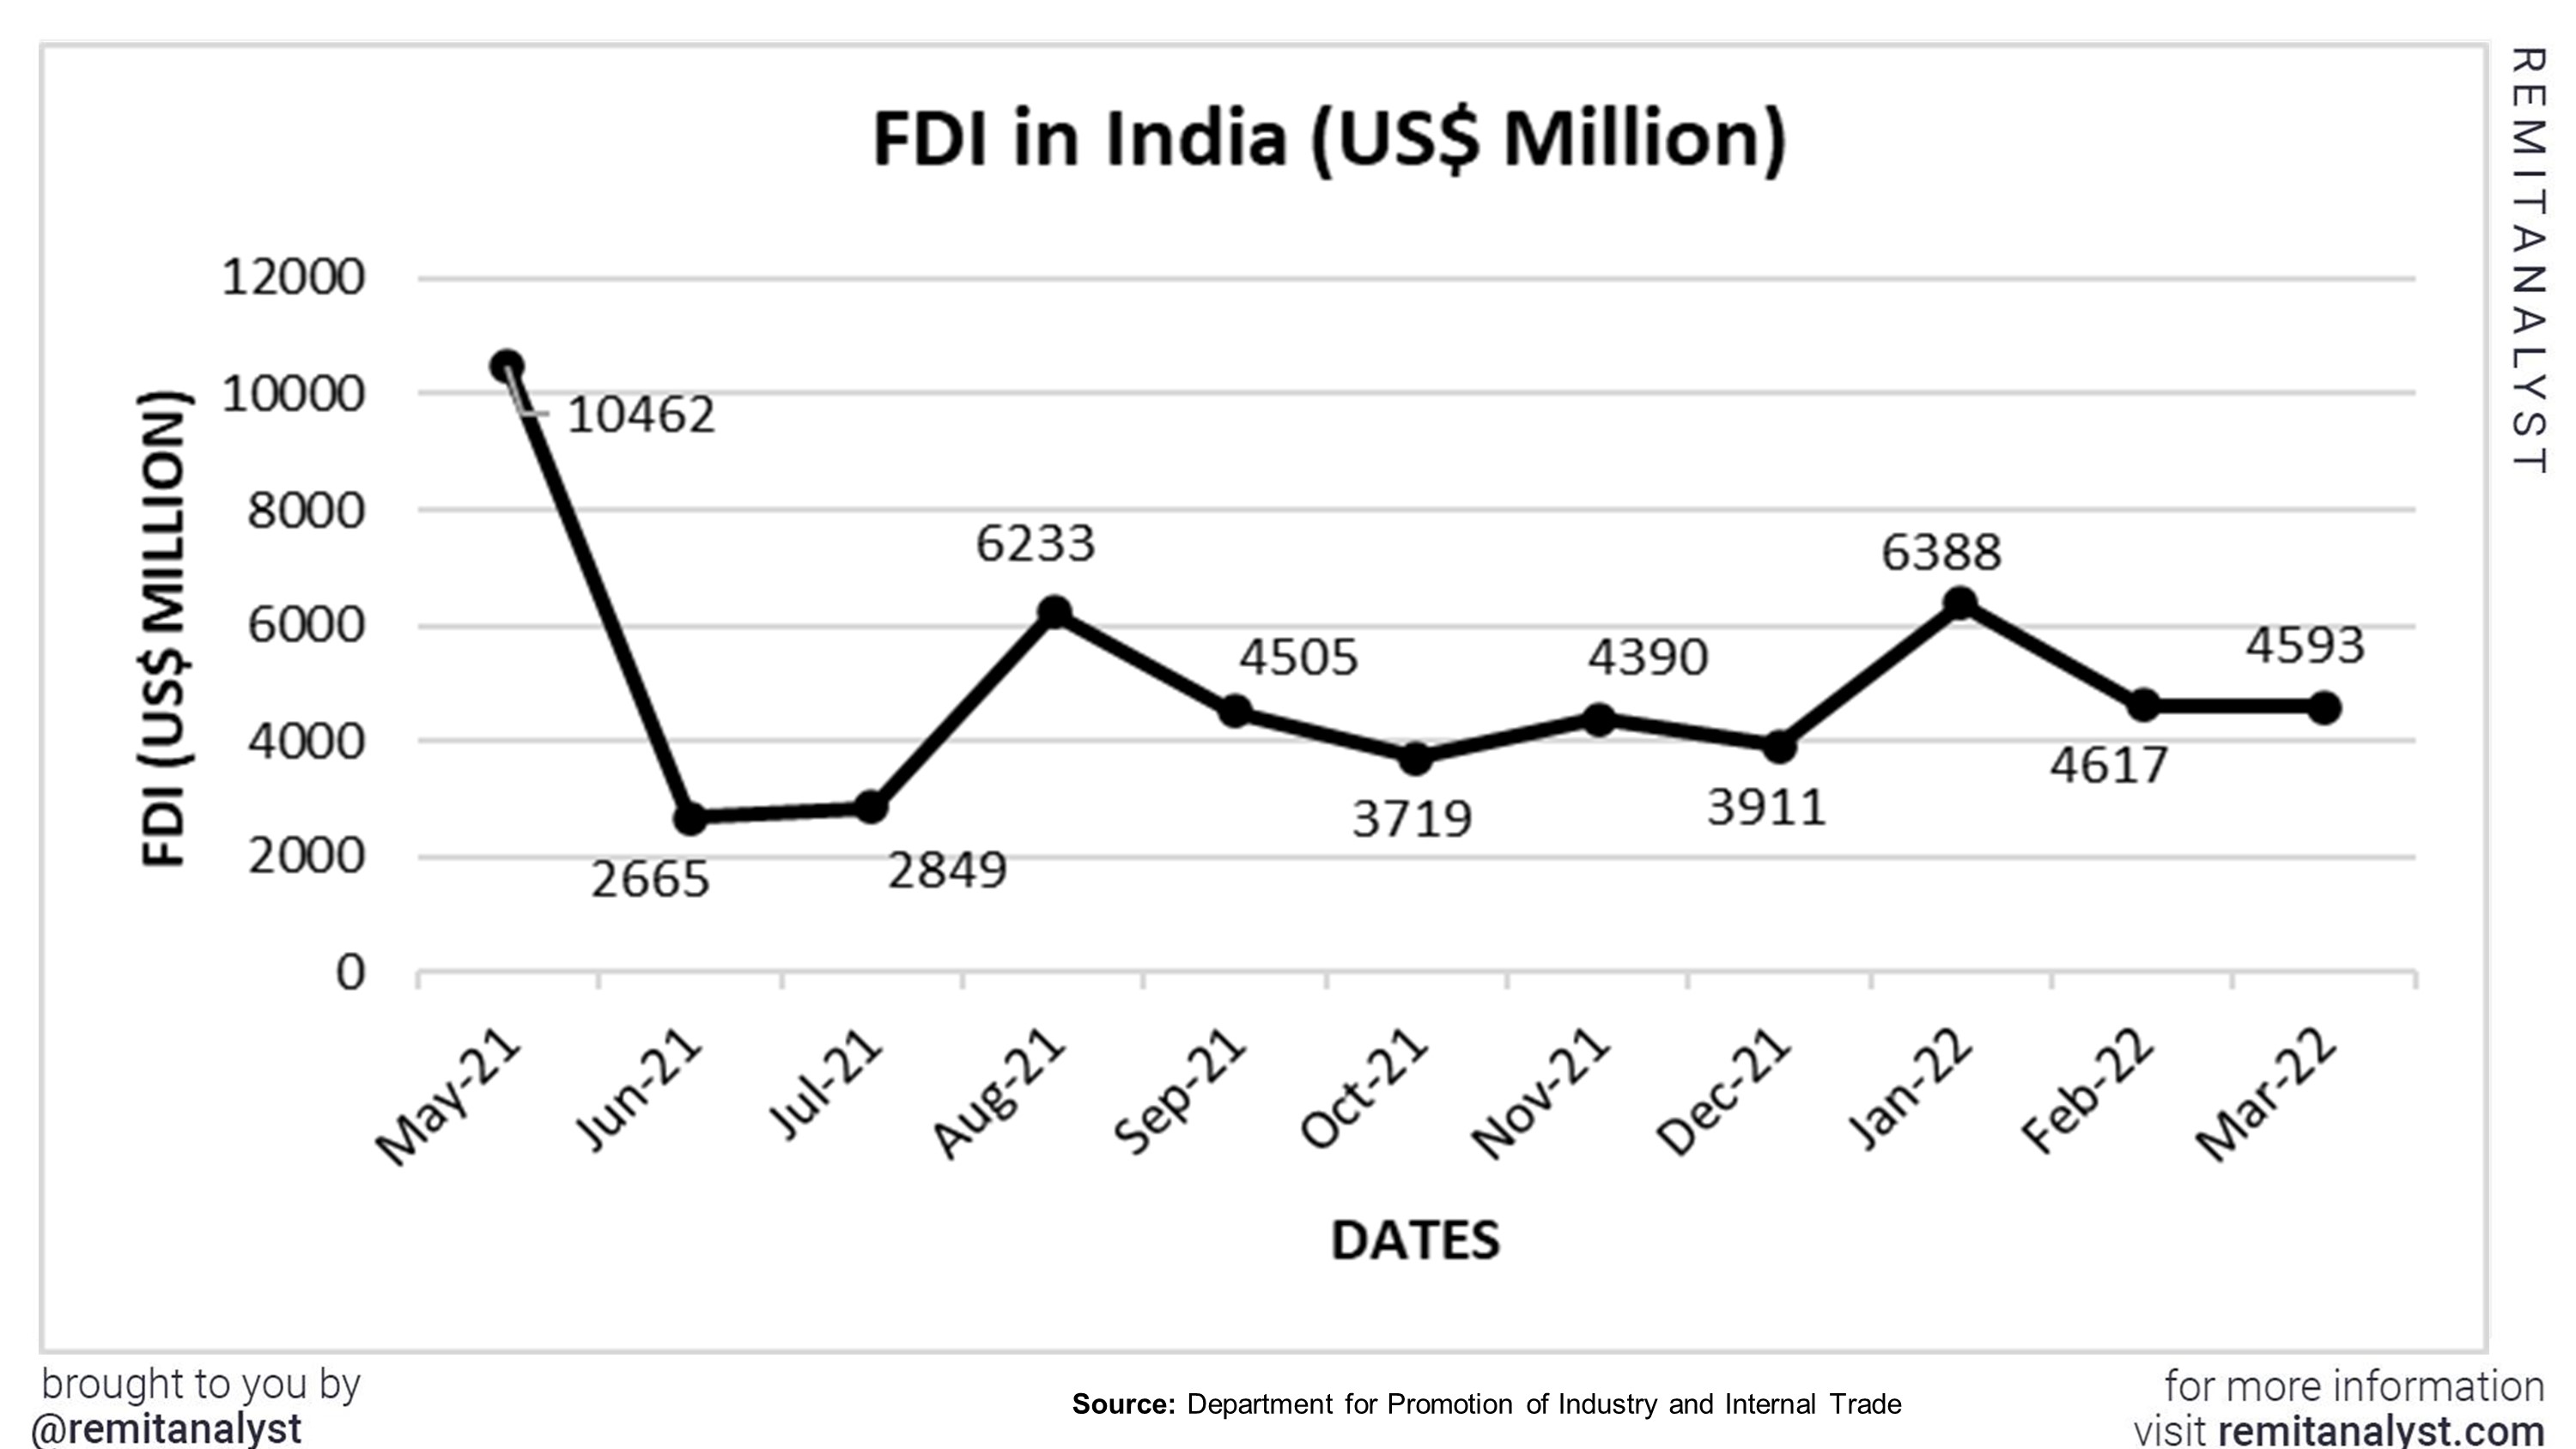
Rising foreign investments suggest that the local currency is declining. The RBI sells USD when it wishes to appreciate the value of the rupee, on the other hand, the RBI buys USD when it wishes to depreciate the rupee. In the financial year 2021-22, around $83B worth of foreign investments were made. The financial year 2022-23 is predicted to cross investments worth more than $100B. This could only suggest that the value of the rupee is expected to fall further.
Similarly, a decline in domestic investments suggests that there is a rise in inflation, which leads to the devaluation of the currency. For instance, India’s consumer spending decreased from 23304. 25B INR in the fourth quarter of 2022 to 22624. 15B INR in the first quarter of 2022. This correlates with the rise in inflation rates. As the graph below suggests, the amount of FDI equity inflow has been unstable and has been decreasing since January, 2022.